A/B Storytelling: Interactive Television, Audience Labor, and the Audience Commodity
Ryan Stoldt / University of Iowa
Interactive television programs like Black Mirror: Bandersnatch (Netflix, 2018), Bear Gryll’s You Vs. Wild (Netflix, 2019), and Puss in Boots: Trapped in an Epic Tale (Netflix, 2017) let audiences partially choose how they would like stories to unfold. These interactions empower audiences by making each individual a fully active participant in the storytelling process of television. Yet, as interactive television lets audiences pursue the stories and cultural interests that appeal to them, the interactivity also provides data to platforms about how audiences engage with stories. This essay argues that interactive television programming expands on concerns about exploited audience labor in television through their interactions with stories.
Political economy of communications scholar Dallas Smythe argued that television audiences serve as commodities that can be sold by television networks to advertisers.[ (( Smythe, D. W. (1981). On the audience commodity and its work. Media and cultural studies: Keyworks, 230, 256. ))] Smythe believed the primary value of television programming for the industry was that programming served as a “free lunch” to make audiences available to advertisers. The audiences’ labor of watching shows served the financial interests of the corporations. Services like Netflix, who are investing heavily in interactive television, do not sell to advertisers though, which raises questions about if and how audience labor is exploited by subscription-based services.
I’ve previously argued that data formed through audiences’ consumption of film and television content on internet-distributed film and television services still exploits audience labor.[ ((Stoldt, R. (Forthcoming). Just One More Episode: Binge-Watching Poetics and Big Data in Non-Linear Television Portals.))] Because audiences actively engage in making choices through interactive television, these interactive programs offer additional data to platforms beyond the data gathered with audiences’ viewing of traditional television programming.
Interactive television programs algorithmically distribute content based on a computational system that offers two story options for audiences to choose between. Each audience choice opens up new choices for the audience member to make as the narrative unfolds. From the platforms’ perspective, these technological and narrative choices match many of the data-gathering goals of marketing and computing’s A/B testing.
A/B testing compares performance rates of two competing messages within and across audience segments. In both marketing and computing, A/B testing shows two messages to a small segment of an audience population before the better performing message is sent to the full audience population. Because interactive television offers two choices to audiences repeatedly throughout a program, the format offers a useful tool for the creation of data on audience preference and difference. While the interactive shows do not become actualized with a definite ending determined by the more popular choice, like how most A/B testing concludes, this data in audiences’ tastes provides value both internally and externally to the platforms. To date, the former has been the focus of services like Netflix because their economic model is based around subscriptions instead of advertisements.
Data can be used internally by internet-distributed video platforms as information that can offer insights into future decisions about programming. Through this formulation of the value of data, the value of the audience commodity shifts from Smythe’s externally focused commodity to be sold to advertisers to an internally focused commodity used as informational capital for future decisions. This data offers insight into what types of stories to tell, how to tell them, and who is interested in which programs to platforms.

In 2013, New York Times columnist David Carr reported that Netflix created their show House of Cards (2013-2018) specifically to be a hit by looking at where data overlapped between genre, director, and actor.[ (( Carr, D. (2013). Giving viewers what they want. The New York Times. Retrieved from https://www.nytimes.com/2013/02/25/business/media/for-house-of-cards-using-big-data-to-guarantee-its-popularity.html ))] By using data on David Fincher, Kevin Spacey, and the British version of House of Cards, Netflix claimed to create their most watched show at the time. Television studies scholar Tim Havens has usefully noted that these categories of data are not new to internet-distributed television platforms despite being discursively promoted as new.[ (( Havens, T. (2014). Media programming in an era of big data. Media Industries Journal, 1(2). ))] Data on the popularity of directors, actors, and genres have long been accessible to media industries. However, the continued use of data based on audience consumption to make programming decisions remains exploitative of audience labor, and internet-distributed television platforms continue to use this data in ways the industry long has. Interactive television offers direct ways to see what genres of stories audiences might be more interested in.
Other popular writings have suggested new ways of using audience data. Writer, director, and producer Cary Fukunaga provided further insight into how internet-distributed television services use audience data in an interview for GQ.[ (( Baron, Z. (2018). Cary Fukunaga doesn’t mind taking notes from Netflix’s algorithm. GQ. Retrieved from https://www.gq.com/story/cary-fukunaga-netflix-maniac ))] While Fukunaga was creating Maniac (2018), Netflix provided data to him about how audiences prefer to see stories unfold. Fukunaga said, “Because Netflix is a data company, they know exactly how their viewers watch things. ”¦So they can look at something you’re writing and say, We know based on our data that if you do this, we will lose this many viewers. So it’s a different kind of note-giving. It’s not like, Let’s discuss this and maybe I’m gonna win. The algorithm’s argument is gonna win at the end of the day. So the question is do we want to make a creative decision at the risk of losing people” (Italics original). This article suggests that Fukunaga used Netflix’s data to change how his story would be told in order to better engage audiences. This type of narrative change through engagement with data is ripe for the A/B storytelling logic of interactive television. Interactive television provides data about what types of stories are more interesting to audiences than other types of stories. This narrative function goes further down that data about genre that can be gleamed broadly by what types of programs are popular or what type of story people choose in interactive programming.
The A/B logic also usefully denotes differences between different audiences’ tastes. I’ve previously written about how cultural difference affects audiences’ choices in interactive television according to Netflix, noting how British audiences were more likely to choose a storyline based around tea. Because Netflix publicly recognized that different cultures select stories differently on Twitter, they indicated that they gather data about difference in cultural tastes surrounding stories. This data can easily be used to program shows, narratives, or culturally specific moments that might appeal to specific audiences globally.
Finally, interactive television directly provides platforms with data that could be used externally to appeal to advertisers. Although this has rarely been the case to date, analysts have questioned whether product placement offers a way to expand revenue sources for streaming services without compromising their resolve to not have traditional advertisements.[ (( Graham, M. (2019). Netflix partnerships could become more attractive to marketers in a down economy, analysts predict. CNBC. Retrieved from https://www.cnbc.com/2019/10/29/netflix-product-placement-could-increase-with-downturn-forrester.html ))] Regardless, the data gathered through interactive television is ripe for external use.
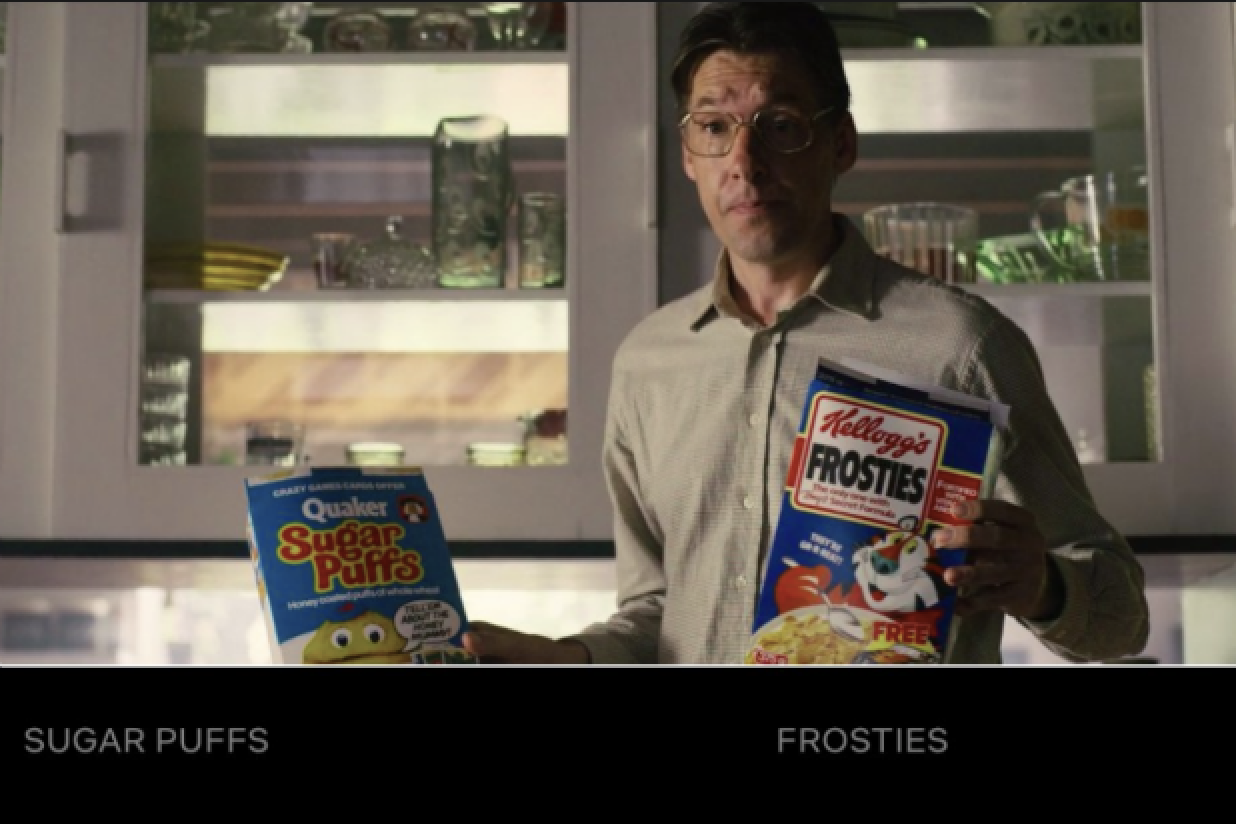
Black Mirror: Bandersnatch begins with users having the choice between two different breakfast cereals: Sugar Puffs and Frosties. The next choice allows audiences to choose to listen to music by either The Thompson Twins or Now 2. While these choices do not matter for the story’s narrative, but instead teach viewers the rules of the interactions, the choices do matter for streaming services’ potential relationship to advertisers. These choices inform platforms about audiences’ interests in some commodities over others, which is the background of large amounts of marketing and sponsorship research. Sponsorship research often asks current customers about their interests to inform clients what types of advertising and sponsorship deals they should be pursuing. Through this data, services could easily approach advertisers and pitch future product placement deals based on the data of audiences’ indicated preferences.
Regardless of whether data is used internally or externally by internet-distributed television services, the audience commodity remains valuable for these services. While the labor of audiences remains largely the same, the production of data for a primarily internal usage serves a different but still valuable purpose to the television industry. Interactive television is not only a formative change in the way audience tell stories but in the way industries gather data.
Image Credits:
- Puss in Boots: Trapped in an Epic Tale is Netflix’s first interactive television program.
- House of Cards was one of Netflix’s first original productions, and The New York Times reported that the show was created based on data.
- Black Mirror: Bandersnatch‘s interactive choices provide data directly on audience preference between commodities.