Over*Flow: Fan Demographics on Archive of Our Own
Lauren Rouse & Mel Stanfill / University of Central Florida

Fans who participate in fan fiction are typically understood as predominantly women[ (( See Camille Bacon-Smith, Enterprising Women: Television Fandom and the Creation of Popular Myth (Philadelphia: University of Pennsylvania Press, 1991); Kristina Busse, Framing Fan Fiction: Literary and Social Practices in Fan Fiction Communities, 1 edition (Iowa City: University Of Iowa Press, 2017); Abigail De Kosnik, Rogue Archives: Digital Cultural Memory and Media Fandom (Cambridge, MA: The MIT Press, 2016); Henry Jenkins, Textual Poachers: Television Fans & Participatory Culture (New York, NY: Routledge, 1992). ))] and predominantly heterosexual,[ (( See Shoshanna Green, Cynthia Jenkins, and Henry Jenkins, “Normal Female Interest in Men Bonking: Selections from the Terra Nostra Underground and Strange Bedfellows,” in Theorizing Fandom: Fans, Subculture and Identity, ed. Cheryl Harris and Alison Alexander (Creskill, NJ: Hampton Press, 1998), 9-38; Eden Lackner, Barbara Lynn Lucas, and Robin Anne Reid, “Cunning Linguists: The Bisexual Erotics of Words/Silence/Flesh,” in Fan Fiction and Fan Communities in the Age of the Internet: New Essays, ed. Karen Hellekson and Kristina Busse (Jefferson, NC: McFarland, 2006), 189-206; Constance Penley, NASA/Trek: Popular Science and Sex in America (New York, NY: Verso, 1997). ))] though as Green, Jenkins, and Jenkins noted early on, “lesbian and bisexual women have always participated alongside straight women in slash fandom.”[ (( “Normal Female Interest in Men Bonking,” 11. ))] However, actual data addressing fan fiction writer and reader demographics is rare. While researchers have included demographics in surveys,[ (( See Casey Fiesler and Brianna Dym, “Moving Across Lands: Online Platform Migration in Fandom Communities,” Proceedings of the ACM on Human-Computer Interaction 4, no. CSCW1 (May 28, 2020): 1-25, https://doi.org/10.1145/3392847. ))] the last publicized demographics survey of fanfiction hosting site Archive of Our Own (AO3) was centreoftheselights’s 2013 AO3 Census. Scholars have long used this survey as a foundation, but current data would be more beneficial.
To address this need, we collected 5,000 responses via Qualtrics between February 22 and March 21, 2022. In developing this survey, we researched common demographics questions to determine what was both typical and useful. Because we distributed the survey on social media, it was possible our survey would circulate globally; as a result, we phrased questions, such as about race and ethnicity, as open-ended, since categories differ across countries. The survey was initially released on Twitter and the subreddit r/FanFiction. After participant feedback, we added several options for gender and sexuality, as well as an “I only use AO3” option to the question: “What other platforms do you use for fan fiction?” On March 7, 2022, we also released the survey on Tumblr. These multiple seed locations helped reach a broader cross-section of the AO3-using population.
Gender, Sexuality, and Romantic Orientation
Gender
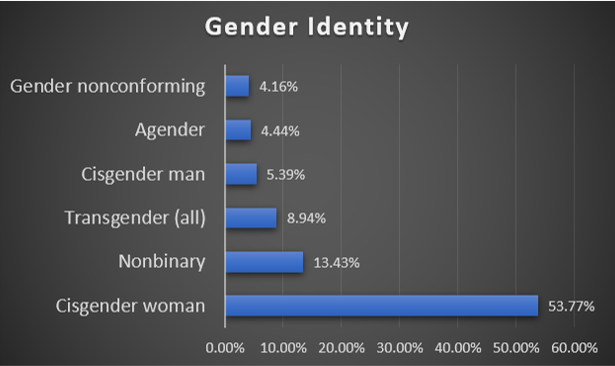
As expected, cisgender women were the largest population, 53.77% of responses to “Which option best identifies your gender?” In addition to this minor overrepresentation, overall gender identities diverge noticeably from the general population. The next largest category is nonbinary (13.43%). Transgender identities (transfeminine, transgender, transgender man, transgender woman, transmasculine) were 8.94%. One notable criticism of our initial survey was that while we provided “transgender,” “transmasculine,” and “transfeminine,” these options are often used as adjectives for transgender people instead of being identities in themselves. Before releasing the survey on Tumblr, we added “transgender man” and “transgender woman”; however, as no trans identity exceeded 4%, we recoded all transgender options into one category to make them visible at scale. Overall, 59.18% of our respondents are cisgender and 40.82% are non-cisgender (including nonbinary, transgender [all], agender, gender nonconforming, genderfluid, demigirl); focusing on the United States to compare to the overall population, 34.53% are non-cisgender compared to 0.6% of Americans, meaning non-cisgender people are more than 55 times more prevalent in our sample of fans who use AO3 than in the U. S. overall.
| Identity | % |
|---|---|
| Cisgender woman | 53.77% |
| Nonbinary | 13.43% |
| Transgender (all) | 8.94% |
| Cisgender man | 5.39% |
| Agender | 4.44% |
| Gender nonconforming | 4.16% |
Sexuality
The largest group of respondents were on the asexual spectrum (27.66%), including asexual (18.93%), demisexual (5.73%), greysexual (2.93%), and aegosexual (0.05%).[ (( This spectrum reflects variation within the group. Some asexual people may not experience sexual attraction at all; for others, sexual attraction is contingent on circumstances or emotional bonds. ))] This is a threefold increase from the 2013 survey, in which 9% identified as asexual. The next largest category was bisexual (24.83%); this is comparable to the 2013 survey (23%). The third most frequent identity was queer (15.04%). Though fan scholars, and fandom itself, and have long hypothesized that fandoms are predominantly straight women, straight/heterosexual represents just 13.92% of responses. Kristina Busse notes that “anecdotal evidence and informal polls suggest that the number of self-identified nonstraight women is proportionally greater in fandom than in the population at large”;[ (( Busse, Framing Fan Fiction, 159. ))] our survey bears this out, with more than 86% selecting a non-straight identity. This may mean the assumption was always incorrect, but more likely increasing awareness and acceptance of queerness mean that people hold different identities than they might have in the past. It is also notable that non-heterosexual identities””82.99% of American respondents, compared to 3.5% in the U.S. population””are 23.7 times more prevalent in our survey as the general population.

| Identity | % |
|---|---|
| Bisexual | 24.83% |
| Asexual | 18.93% |
| Queer | 15.04% |
| Straight/Heterosexual | 13.92% |
| Lesbian | 6.06% |
| Demisexual | 5.73% |
| Pansexual | 4.61% |
| Questioning | 3.25% |
| Greysexual | 2.93% |
| Gay | 2.09% |
Romantic Orientation
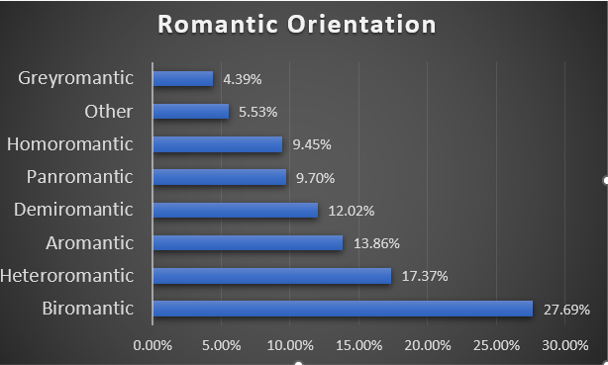
We also asked about romantic orientation. 30.27% of respondents are on the aromantic spectrum (aromantic, 13.86%; demiromantic, 12.02%; greyromantic, 4.39%), 27.69% as biromantic, and 17.37% as heteroromantic. A substantial number of respondents described this question as confusing, and some rejected the premise that people may experience sexual and romantic attraction differently, though the response rate was not substantially lower than other questions.[ (( For some, sexual and romantic attraction is the same, such as someone who is bisexual and biromantic. However, someone else might be pansexual for their sexual attraction and aromantic for their romantic attraction. ))] While it is unfortunate to have confused some participants, responses suggest that romantic orientation is a contested concept within this population, a valuable finding.
| Identity | % |
|---|---|
| Biromantic | 27.69% |
| Heteroromantic | 17.37% |
| Aromantic | 13.86% |
| Demiromantic | 12.02% |
| Panromantic | 9.70% |
| Homoromantic | 9.45% |
| Other | 5.53% |
| Greyromantic | 4.39% |
Race and Continent
Race and Ethnicity
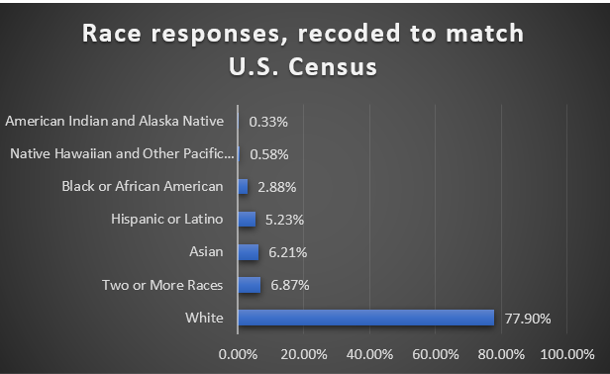
For race, we used an open-end question. While race is a standard demographic category in the U.S. where we are based, a substantial number of participants responded negatively to the question and more than 300 skipped it. Narrowing to the U.S. population for whom we have a demographic comparison and re-coding free-form responses to match U.S. Census categories, white people were overrepresented: 77.9% said only white or a synonym such as Caucasian, European, or Anglo; 59.3% of the US population identified as white alone in the 2020 census (31% overrepresented). Respondents who listed more than one race were even more overrepresented, 7.49% compared to 2.9% in the Census (158% overrepresented). There were small-scale overrepresentations among Native Hawaiians and Other Pacific Islanders (0.58% survey, 0.3% Census) and Asians (6.87% survey, 6.1% Census). By contrast, Hispanic or Latino (6.21% survey, 18.9% Census), Black or African American (2.88% survey, 13.6% Census), and American Indian and Alaska Native (0.33% survey, 1.3% Census) people are significantly underrepresented.
| Race and Ethnicity | % |
|---|---|
| White | 77.90% |
| Asian | 5.23% |
| Hispanic or Latino | 6.87% |
| Two or More Races | 6.21% |
| Black or African American | 2.88% |
| Native Hawaiian and Other Pacific Islander | 0.58% |
| American Indian and Alaska Native | 0.33% |
Continent
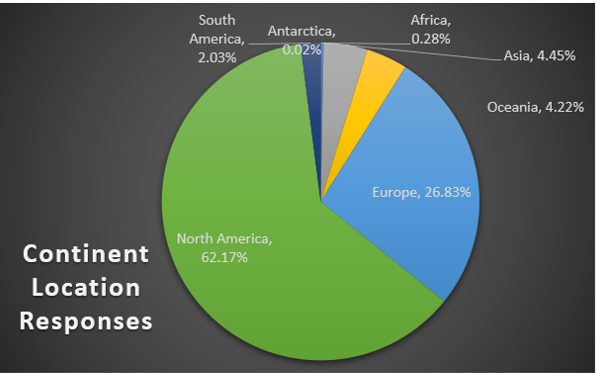
More than 62% of survey participants are from North America and 26% are from Europe. These are significant overrepresentations: about 9% of the world’s population lives in Europe and 4% in North America. The fact that the solicitation and survey were only in English was likely a factor,[ (( However, Qualtrics offers free automatic translation using the Google Translate API, and chatter on social media suggested at least some respondents were using it. ))] though AO3’s interface is also available only in English.[ ((Users can, however, post works in languages other than English. ))] Only 4.4% of responses are from Asia, compared to over 59% of the world’s population. Notably, AO3 is blocked in China, which likely influenced our findings.[ (( Though using a VPN can circumvent such bans, this requires significant technical knowledge and is not a workable solution for many users. ))]
| Continent | % |
|---|---|
| Africa | 0.28% |
| Antarctica | 0.02% |
| Asia | 4.45% |
| Oceania | 4.22% |
| Europe | 26.83% |
| North America | 62.17% |
| South America | 2.03% |
Age
Our survey included only participants 18 and older because participants under 18 would have required parental consent. Therefore, we do not have data for users younger than 18, though AO3 allows users as young as 13.[ (( As stated in the Terms of Service, “In compliance with United States regulations regarding online privacy for children, the Archive does not knowingly solicit or collect information from children under the age of thirteen (13). Children under the age of thirteen (13) are therefore not permitted to have an account or upload Content of any type to the Archive. By submitting Content to the Archive, you thereby confirm that you are thirteen (13) years old or older.” )) ] Our data shows that AO3 users skew younger than Twitter, with 78.97% aged 18-34 compared to 55.6% on Twitter. On the other hand, AO3 is somewhat older than Tumblr, with 35.51% of users 18-24, compared to more than 40% of Tumblr users between 18 and 25. These demographics suggest research on AO3 should be mindful that younger fans may be missed.
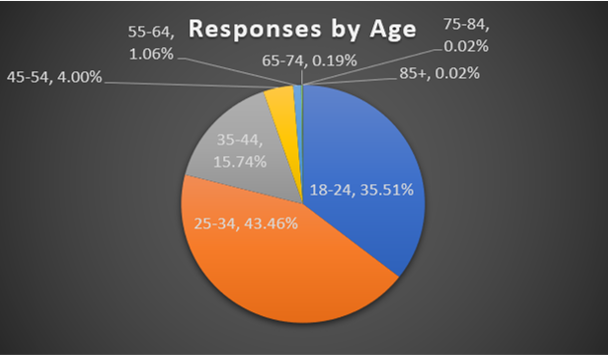
| Age | % |
|---|---|
| 18-24 | 35.51% |
| 25-34 | 43.46% |
| 35-44 | 15.74% |
| 45-54 | 4.00% |
| 55-64 | 1.06% |
| 65-74 | 0.19% |
| 75-84 | 0.02% |
| 85+ | 0.02% |
Fandom Questions
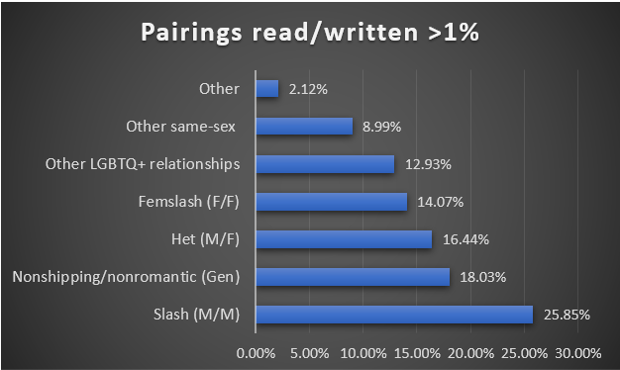
We also asked about fan-specific topics, including practices on AO3, general preferences for pairings when reading or writing, primary pairings when reading or writing, and other sites used. In general, AO3 is used primarily to read (34.60%), comment (27.03%), and write fics (22.22%). Some fans interact with fandom friends (6.96%), but participants generally use other platforms like Tumblr, Discord, or Twitter for this purpose. When fans reported what they read, rates did not vary substantially across content, with slash pairings at 25.85%, nonshipping/nonromantic content (commonly referred to as “gen”) at 18.03%, het (typically man/woman relationships) at 16.44%, and femslash (typically woman/woman relationships), 14.07%. However, most readers identified slash pairings as their primary pairing (51.32%), bearing out observations about the dominance of slash fandom.
| Shipping Type | % |
|---|---|
| Slash (M/M) | 25.85% |
| Nonshipping/nonromantic (Gen) | 18.03% |
| Het (M/F) | 16.44% |
| Femslash (F/F) | 14.07% |
| Other LGBTQ+ relationships | 12.93% |
| Other same-sex | 8.99% |
| Other | 2.12% |
Conclusion
Compared to the 2013 survey, we find both change and continuity. As marginalized genders, sexual orientations, and romantic orientations have become more mainstream, their presence in fan populations has increased. Fans have always used fanfiction to “explore and negotiate issues of sexuality by reading and writing their desires, and [”¦] sharing sexual preferences” but to see asexuality and bisexuality surpass heterosexuality, and aromanticism and biromanticism surpass heteroromanticism shows how significantly identities differ in fandom.[ (( Busse, Framing Fan Fiction, 159. ))] We also note some unexpected results in what fans read, especially the increasing popularity of nonshipping/nonromantic content. However, fans still predominantly choose slash relationships as primary, which as other research by centreoftheselights has shown, trends towards white male/white male relationships.
However, despite diversification in many respects, white cisgender women still dominate fandom spaces. Using the U.S. data, where we felt reasonably confident mapping freeform race responses onto standardized categories, 58.67% self-identified as both “cisgender woman” and “white.” This, alongside underrepresentation of Black and Latine people, is consistent with research showing ongoing racism and exclusion of fans of color.[ (( See Rukmini Pande, “Squee from the Margins: Racial/Cultural/Ethnic Identity in Global Media Fandom,” in Seeing Fans: Representations of Fandom in Media and Popular Culture, ed. Lucy Bennett and Paul Booth (New York: Bloomsbury Academic, 2016), 209-20; Rukmini Pande, “Who Do You Mean by ”˜Fan?’ Decolonizing Media Fandom Identity,” in A Companion to Fandom and Fan Studies, ed. Paul Booth (Oxford, UK: Wiley-Blackwell, 2018), 319-32; Alexis Lothian and Mel Stanfill, “An Archive of Whose Own? White Feminism and Racial Justice in Fan Fiction’s Digital Infrastructure,” Transformative Works and Cultures 36 (2021), https://doi.org/10.3983/twc.2021.2119. ))] We recommend that scholars continue to periodically survey fandom for demographics, but also critically examine the dominant forms of whiteness and womanhood that shape these spaces.
This post has been edited to correct typos in the “Age” section. Final corrections made February 25th, 2023.
Image Credits:
- Popular fan fiction hosting site Archive of Our Own (author’s screengrab)
Did you offer the survey to registered users of AO3 exclusively? Or consumers of the site (registered and non-registered)?
I’m curious if you will post the survey questions. Are they just in English or were other languages offered? Different cultures and languages will conflict in how they word genders and sexualities (further complicating comparisons between the options on hand), but it would provide a more diverse base of study within the fandom community!
Have you considered looking into class as a factor in fandom participation? I was recently reading an article about how class factors into the SFF book industry and how authorship tends to self-select for higher-income white-collar workers who have the time to write books, and I feel like that’s an often overlooked aspect when it comes to fic writing. There’s a reason modern fandom is widely considered to have been started by 60s housewives, after all.
77% white users.
That’s kind of a given akhi.
kinda surprised by the percentage of aro and ace folks here, its quite cool to see there’s so many of us. i wonder if there is an in depth research about aro & ace people in fandom?
would also love to see more stats about the intersections of identities, like how many queer people of colour are in fandom etc.
also – im not sure if thats a done thing, and how exactly you shared posts about the survey, but were you able to trace how your posts were shared? eg on tumblr was it reblogged among specific demographics, fandoms, etc?
While I understand the difficulties in collecting and mapping the responses on race, something just doesn’t feel right to me about the way you then draw conclusions from that after explicitly then discarding all non-US responses. As you highlighted, over a quarter of your respondents were in Europe, for example, where demographics are going to vary. Likewise for other areas of the globe.
The US can be quite unique in its make-up and thinking around racial demographics compared to other countries, and so it doesn’t seem right to use it to then draw conclusions for a site with users across the world.
Given the difficulties you highlighted in gathering responses, it may be worth re-thinking the wording and approach to this type of question in future, and also perhaps consider providing a more granular breakdown by country (even if it would be additional work). Otherwise, why bother allowing freeform text, only to then discard non-US responses and categorise the others into standard US census options?
I understand you’re most used to the US, but this sort of US-centric approach in a global survey can be very frustrating for folks in other countries, and denies us the opportunity to understand if we also have over- or under-representation issues within our communities.
Have you thought about examining the role that class plays in fandom participation? Authorship tends to self-select for higher-income white-collar workers who have the time to create books, according to an article I recently read about how class affects the SFF book market. I believe that this is one facet of fic writing that is sometimes disregarded. There’s a reason why many people believe that 60s housewives were the first to initiate modern fandom.
What exactly was this point of this? It’s garbage, unscientific data, non-randomly collected, that you admit processing further to the point hat it’s completely worthless. No actual data of any value has been recovered. It’s an entirely an exercise in pointless navel gazing. It’s bullshit, in other words. You then proceed to compare it to a totally different data set, drawn by totally different methods, that didn’t (as far as anyone knows) use bullshit processing.
You’re comparing watermelons to a bunch of peanuts (that are actually mixed nuts but you’re pretending are peanuts) and pretending like you’ve made contributions of value.
This sort of bullshit is why people laugh and look down at people studying social science. As nearly always, it’s 20 year olds pretending obvious bullshit is meaningful information.