Mapping Media Retail in the Global Midwest: Minneapolis and St. Paul, MN
Dan Herbert / University of Michigan
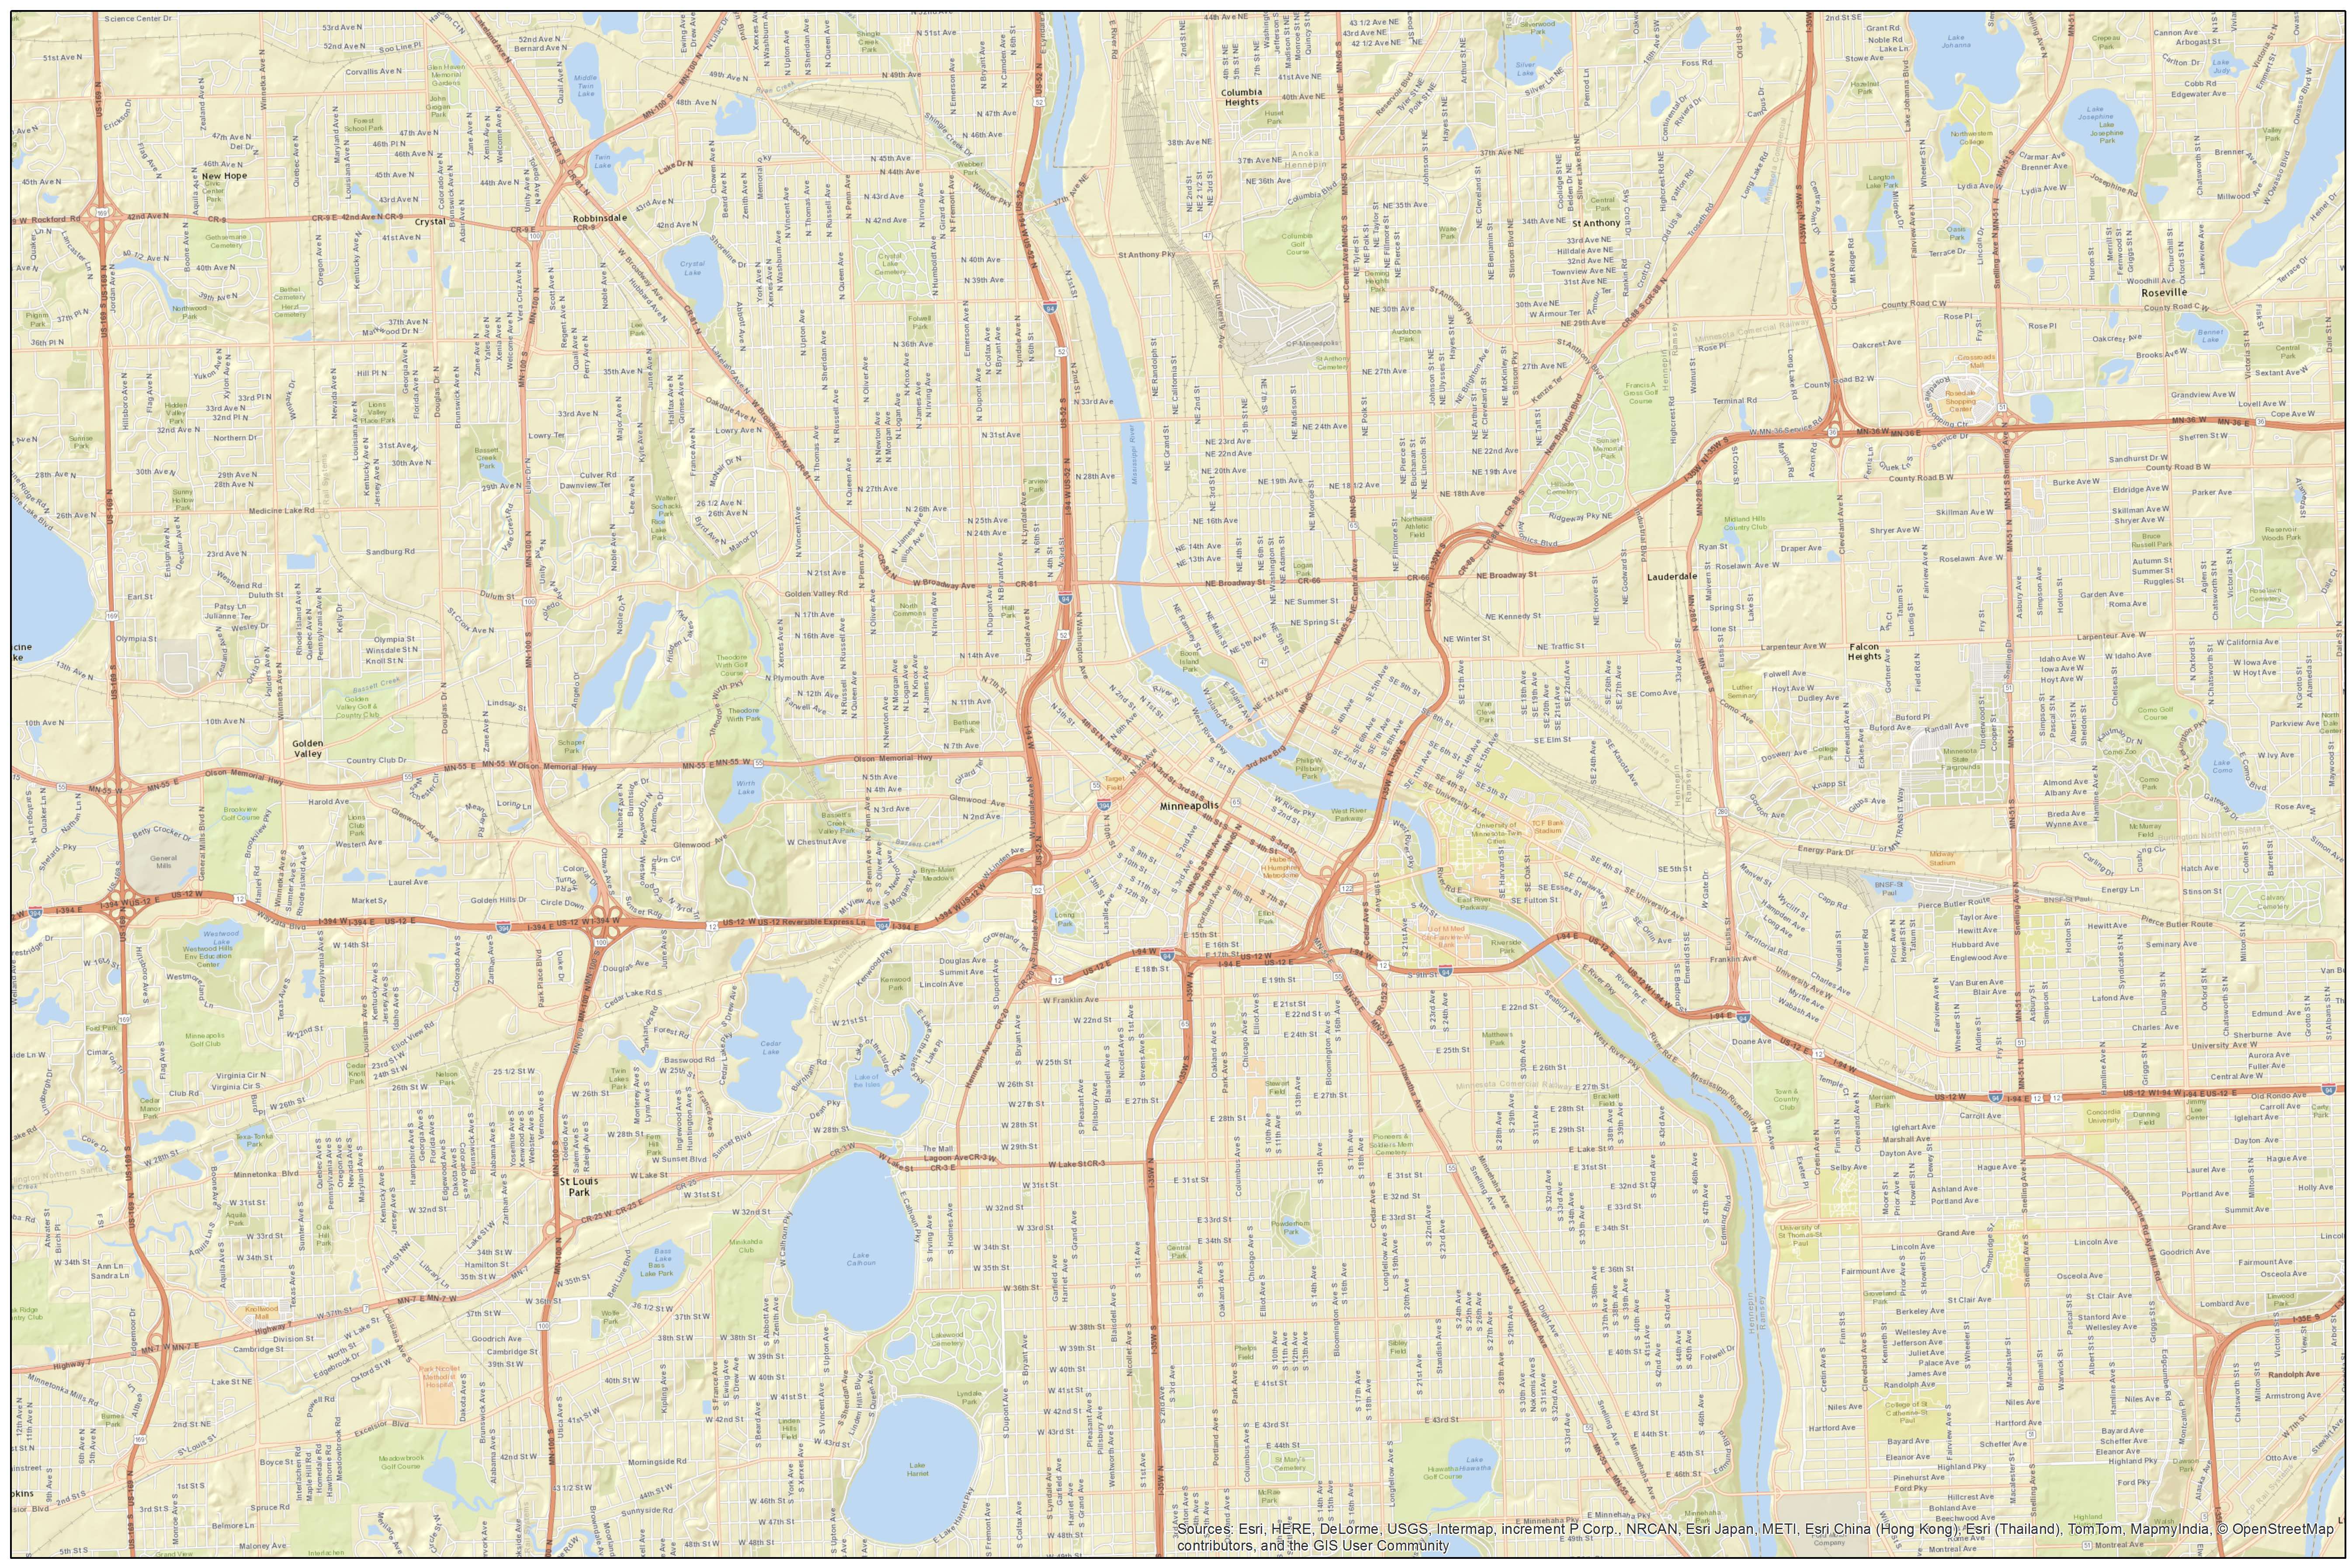
I recently conducted research in Minneapolis and St. Paul, Minnesota, as the last cases in my project to map “entertainment retail” stores in areas of the American Midwest with significant minority and/or diasporic populations. These retail locations include video stores (my primary interest, truthfully), record stores, bookshops, and movie theaters. I have made these maps to indicate different forms of social diversity, particularly along lines of income, race, ethnicity, and national origin, as defined by US Census data.
Throughout this project, I have been interested in simply making the maps and asking a basic question: what do I see? Of course, this leads to countless, more detailed questions, such as: Is there some geographic pattern that these stores exhibit? Is there a significant historical change in the number or location of these stores? Are there discernable alignments between the location of a social group and the retail sites? If not, how might this lack of correlation signify something important as well?
I chose Minneapolis and St. Paul because they have notable diasporic populations: Somalis in Minneapolis and Hmong people in both St. Paul and Minneapolis. I say these groups are “notable” because, despite how cosmopolitan these cities are, the state of Minnesota has been historically understood as “white” because of the large Norwegian and German populations there. But following the end of the Vietnam War, many Hmong people came to this area as refugees, [ ((Anonymous, “Hmong Timeline,” Minnesota Historical Society. Web. Accessed 2 Mar. 2016. http://www.mnhs.org/hmong/hmong-timeline.))] while many Somalis came to Minneapolis as voluntary migrants and yet others came as refugees following the beginning of the Somali Civil War in 1991.[ ((Abdi Roble and Doug Rutledge, The Somali Diaspora: A Journey Away (Minneapolis, MN, USA: University of Minnesota Press, 2008), 3, 135. ProQuest ebrary. Web. Accessed 2 March 2016.))] At this point, the Minneapolis city website boasts, “Minneapolis prides itself on the diversity throughout the city.”[ ((Anonymous, “Diverse Minneapolis,” Minneapolis: City by Nature. Web. Accessed 2 Mar. 2016. http://www.minneapolis.org/visitor/visitor-diverse-minneapolis.))]
These communities are also notable, for the purposes of my project, because I know little about the Twin Cities and almost nothing about Somali-American or Hmong cultures. One of the basic questions for my project is, “What can maps and mapping offer to film and media studies?”[ ((I do not mean to suggest that I am unique in asking this question, as there have been a number of important works in film and media studies that have made use of maps and interrogated how maps might be interpreted by scholars in our field; we can look at least as far back as Ben Singer’s work about nickelodeons in New York, which appeared in Cinema Journal more that twenty years ago. Moreover, I recognize that an entire field of “Critical GIS” has developed over the last twenty years, in which scholars from a range of disciplines have made use of and self-consciously questioned digital mapping technologies and techniques. My three contributions to Flow simply mark my curiosity and small contributions to a much larger, ongoing discourse.))] So I took it as a challenge to map areas and groups that I was unfamiliar with. For me at least, these maps would have to “speak for themselves” to some degree, as I lack any real contextual understanding to help me interpret them.
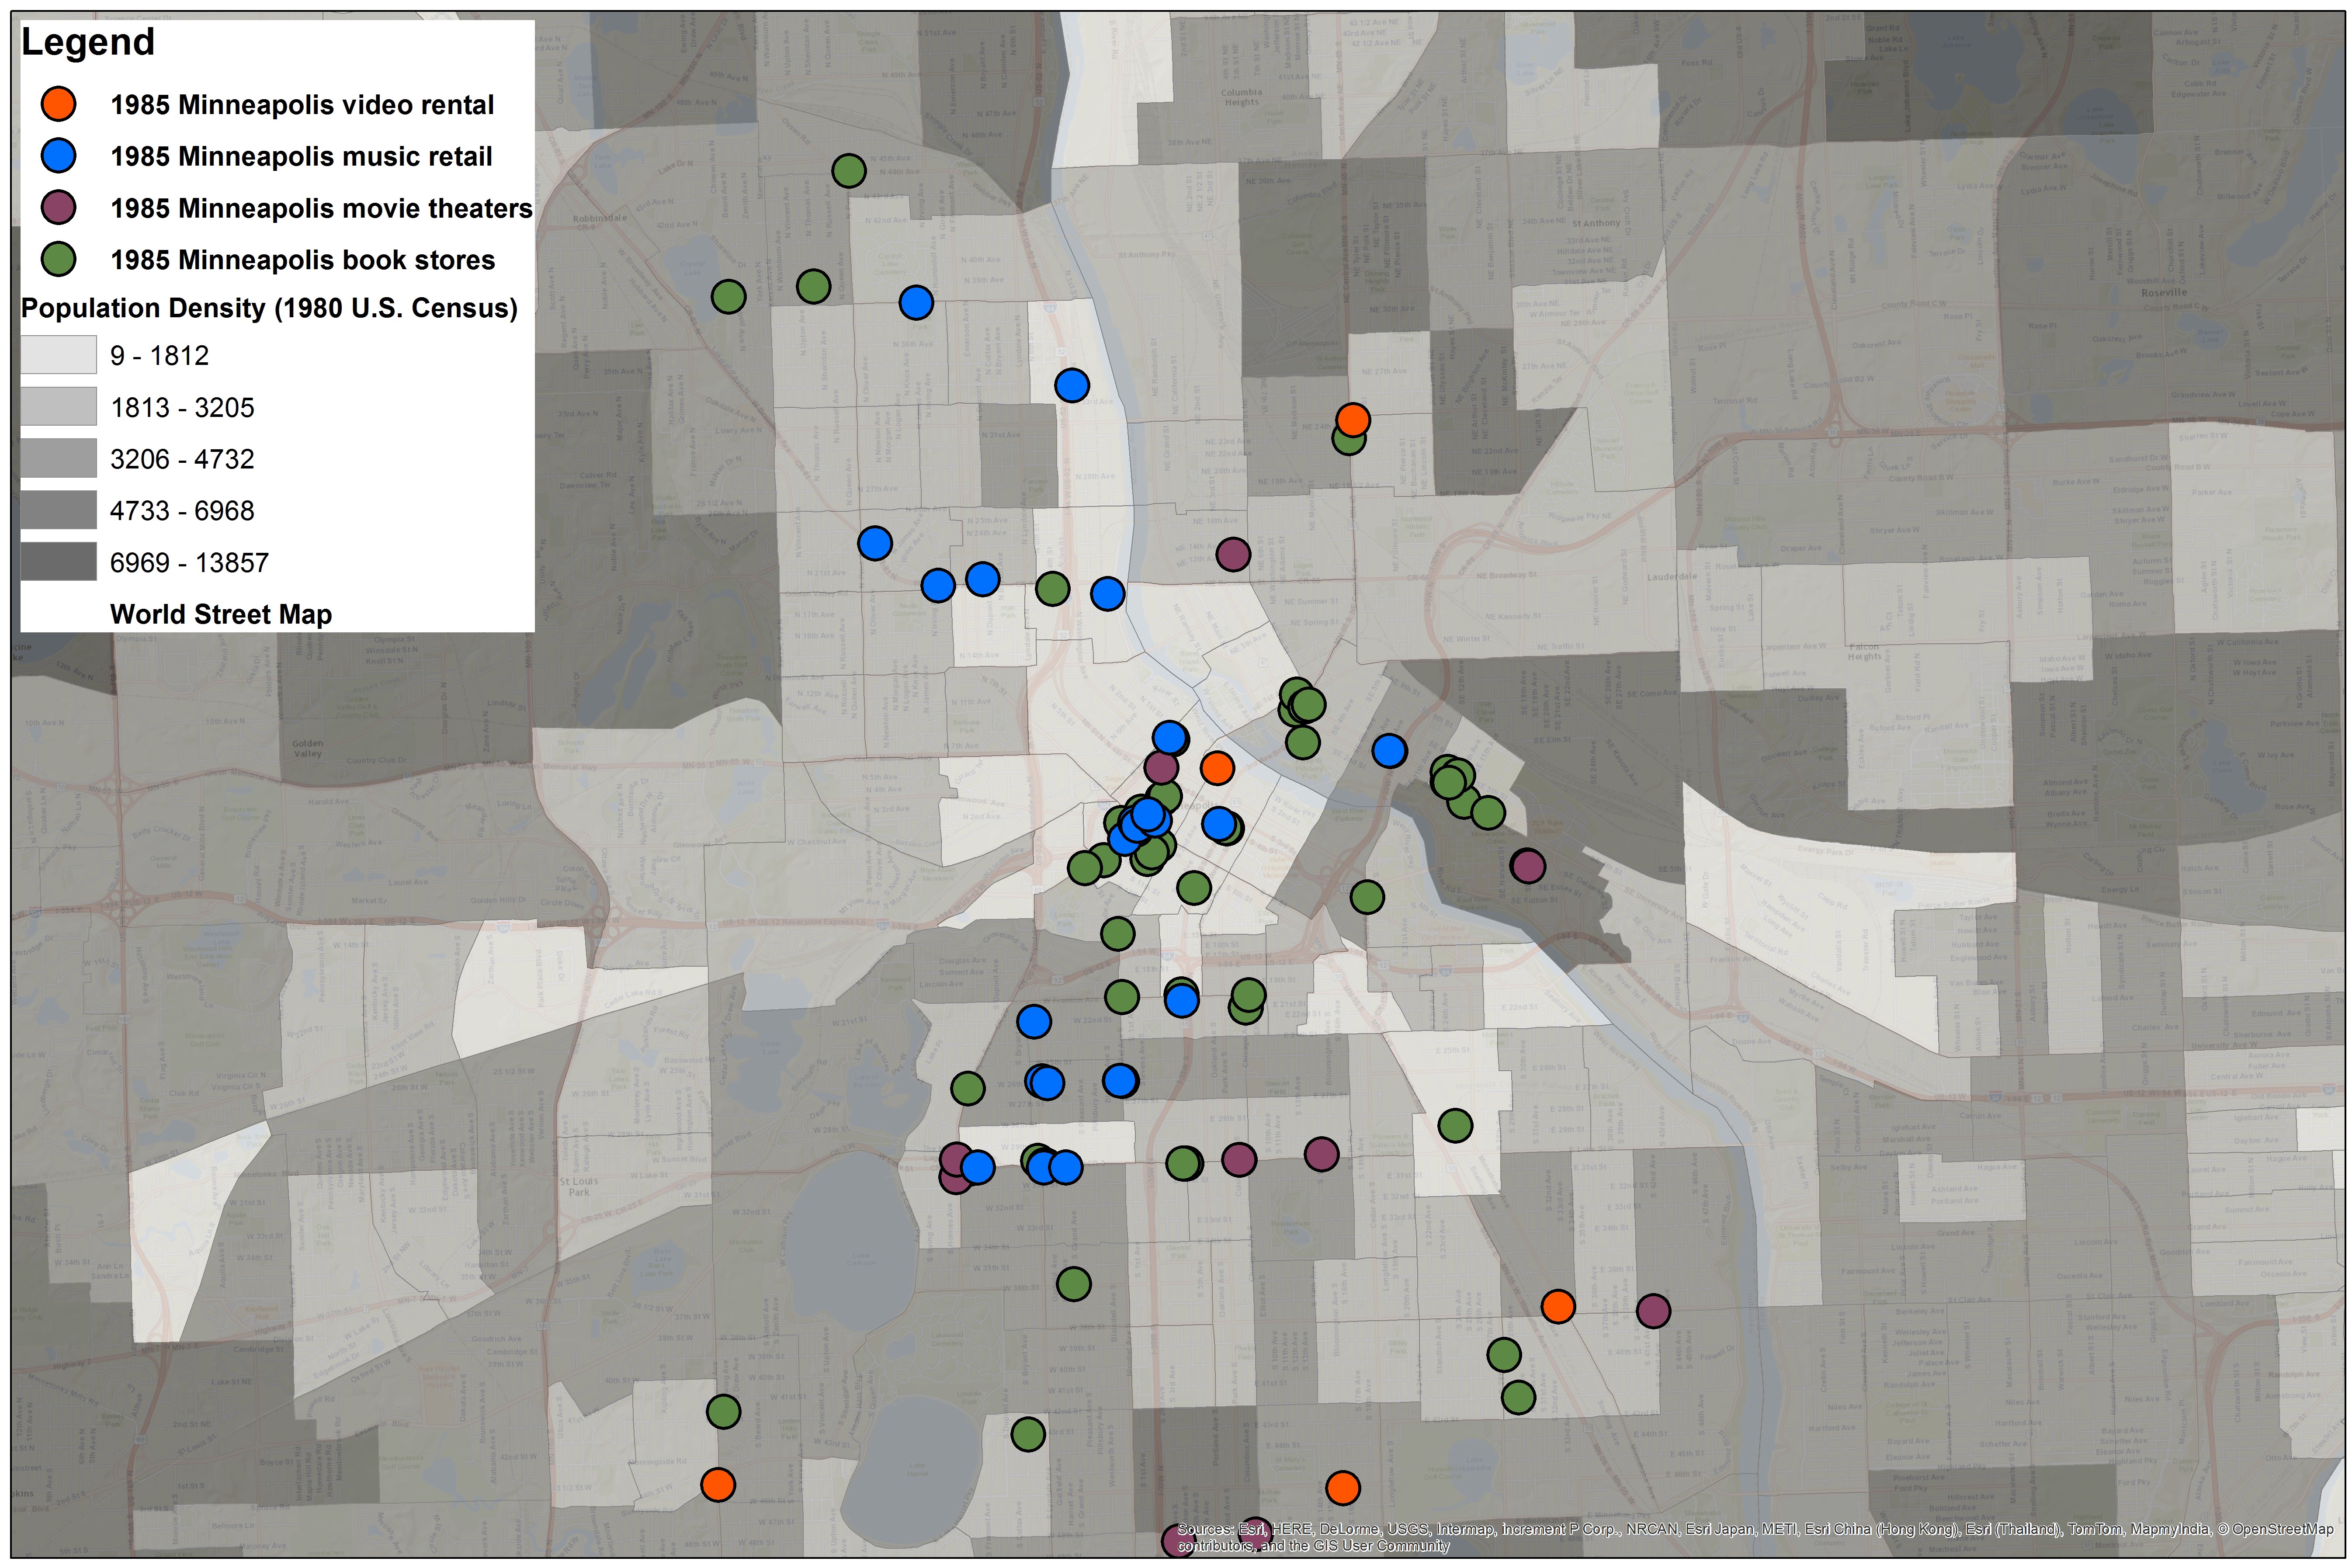
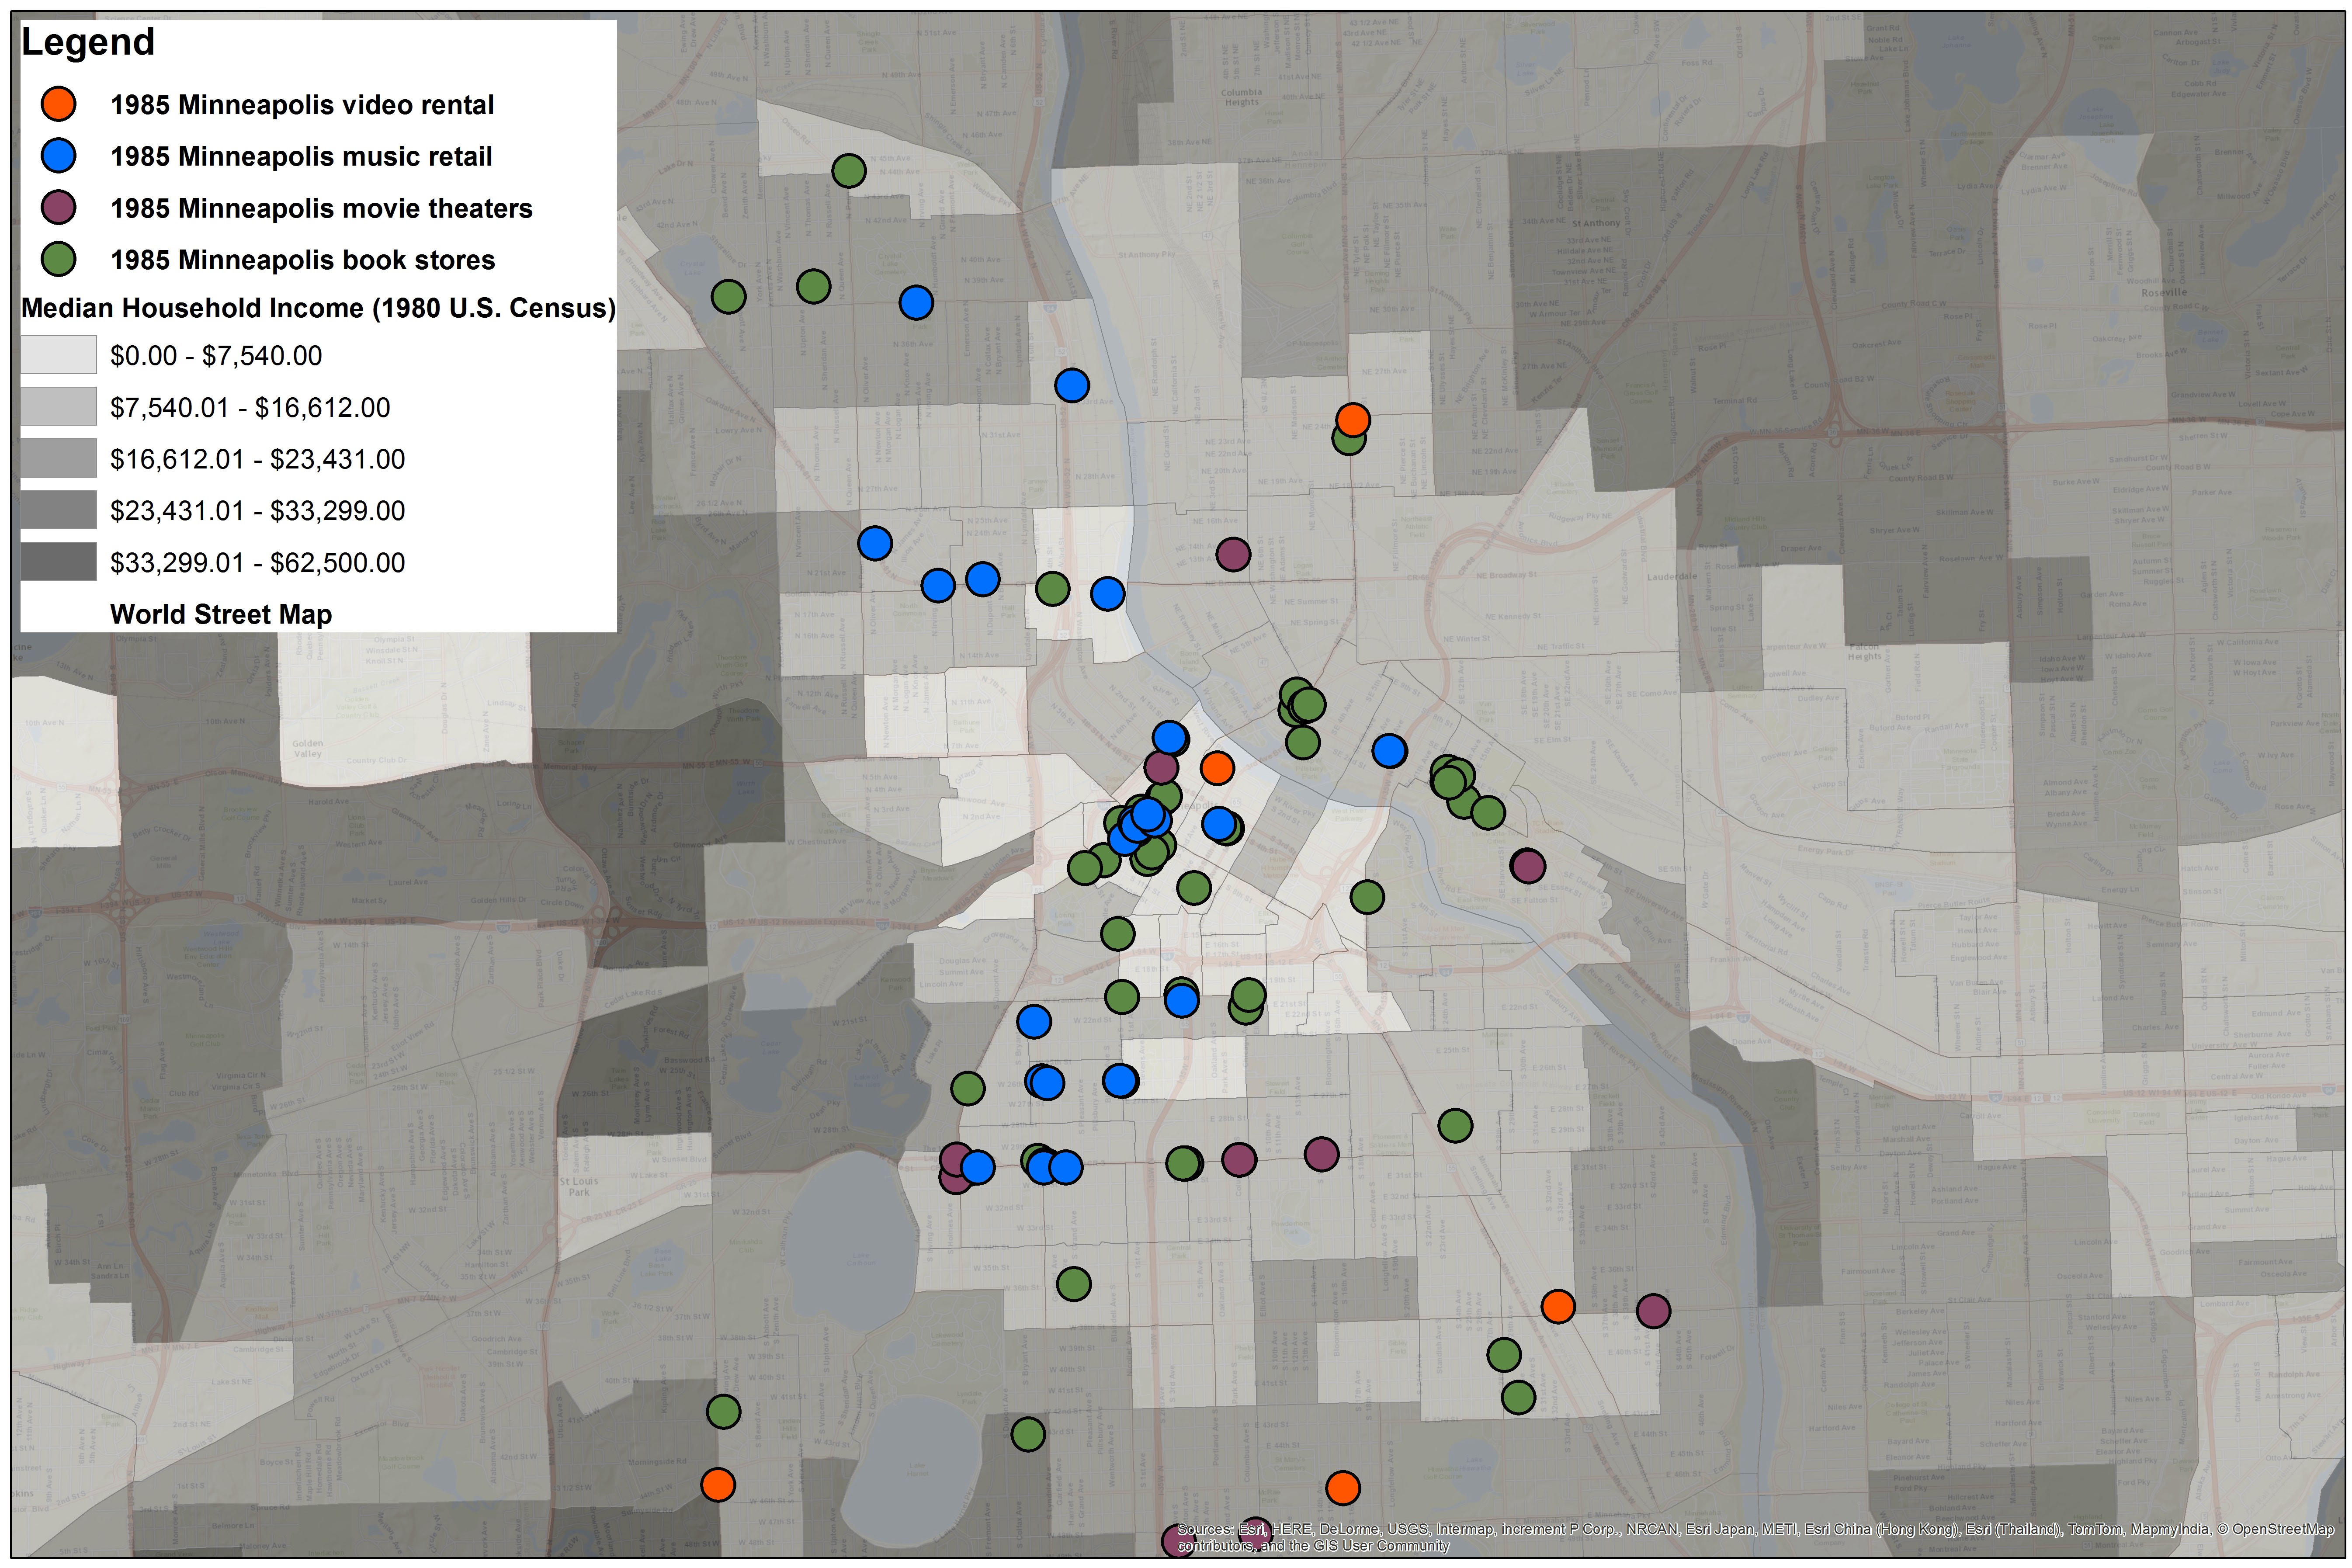
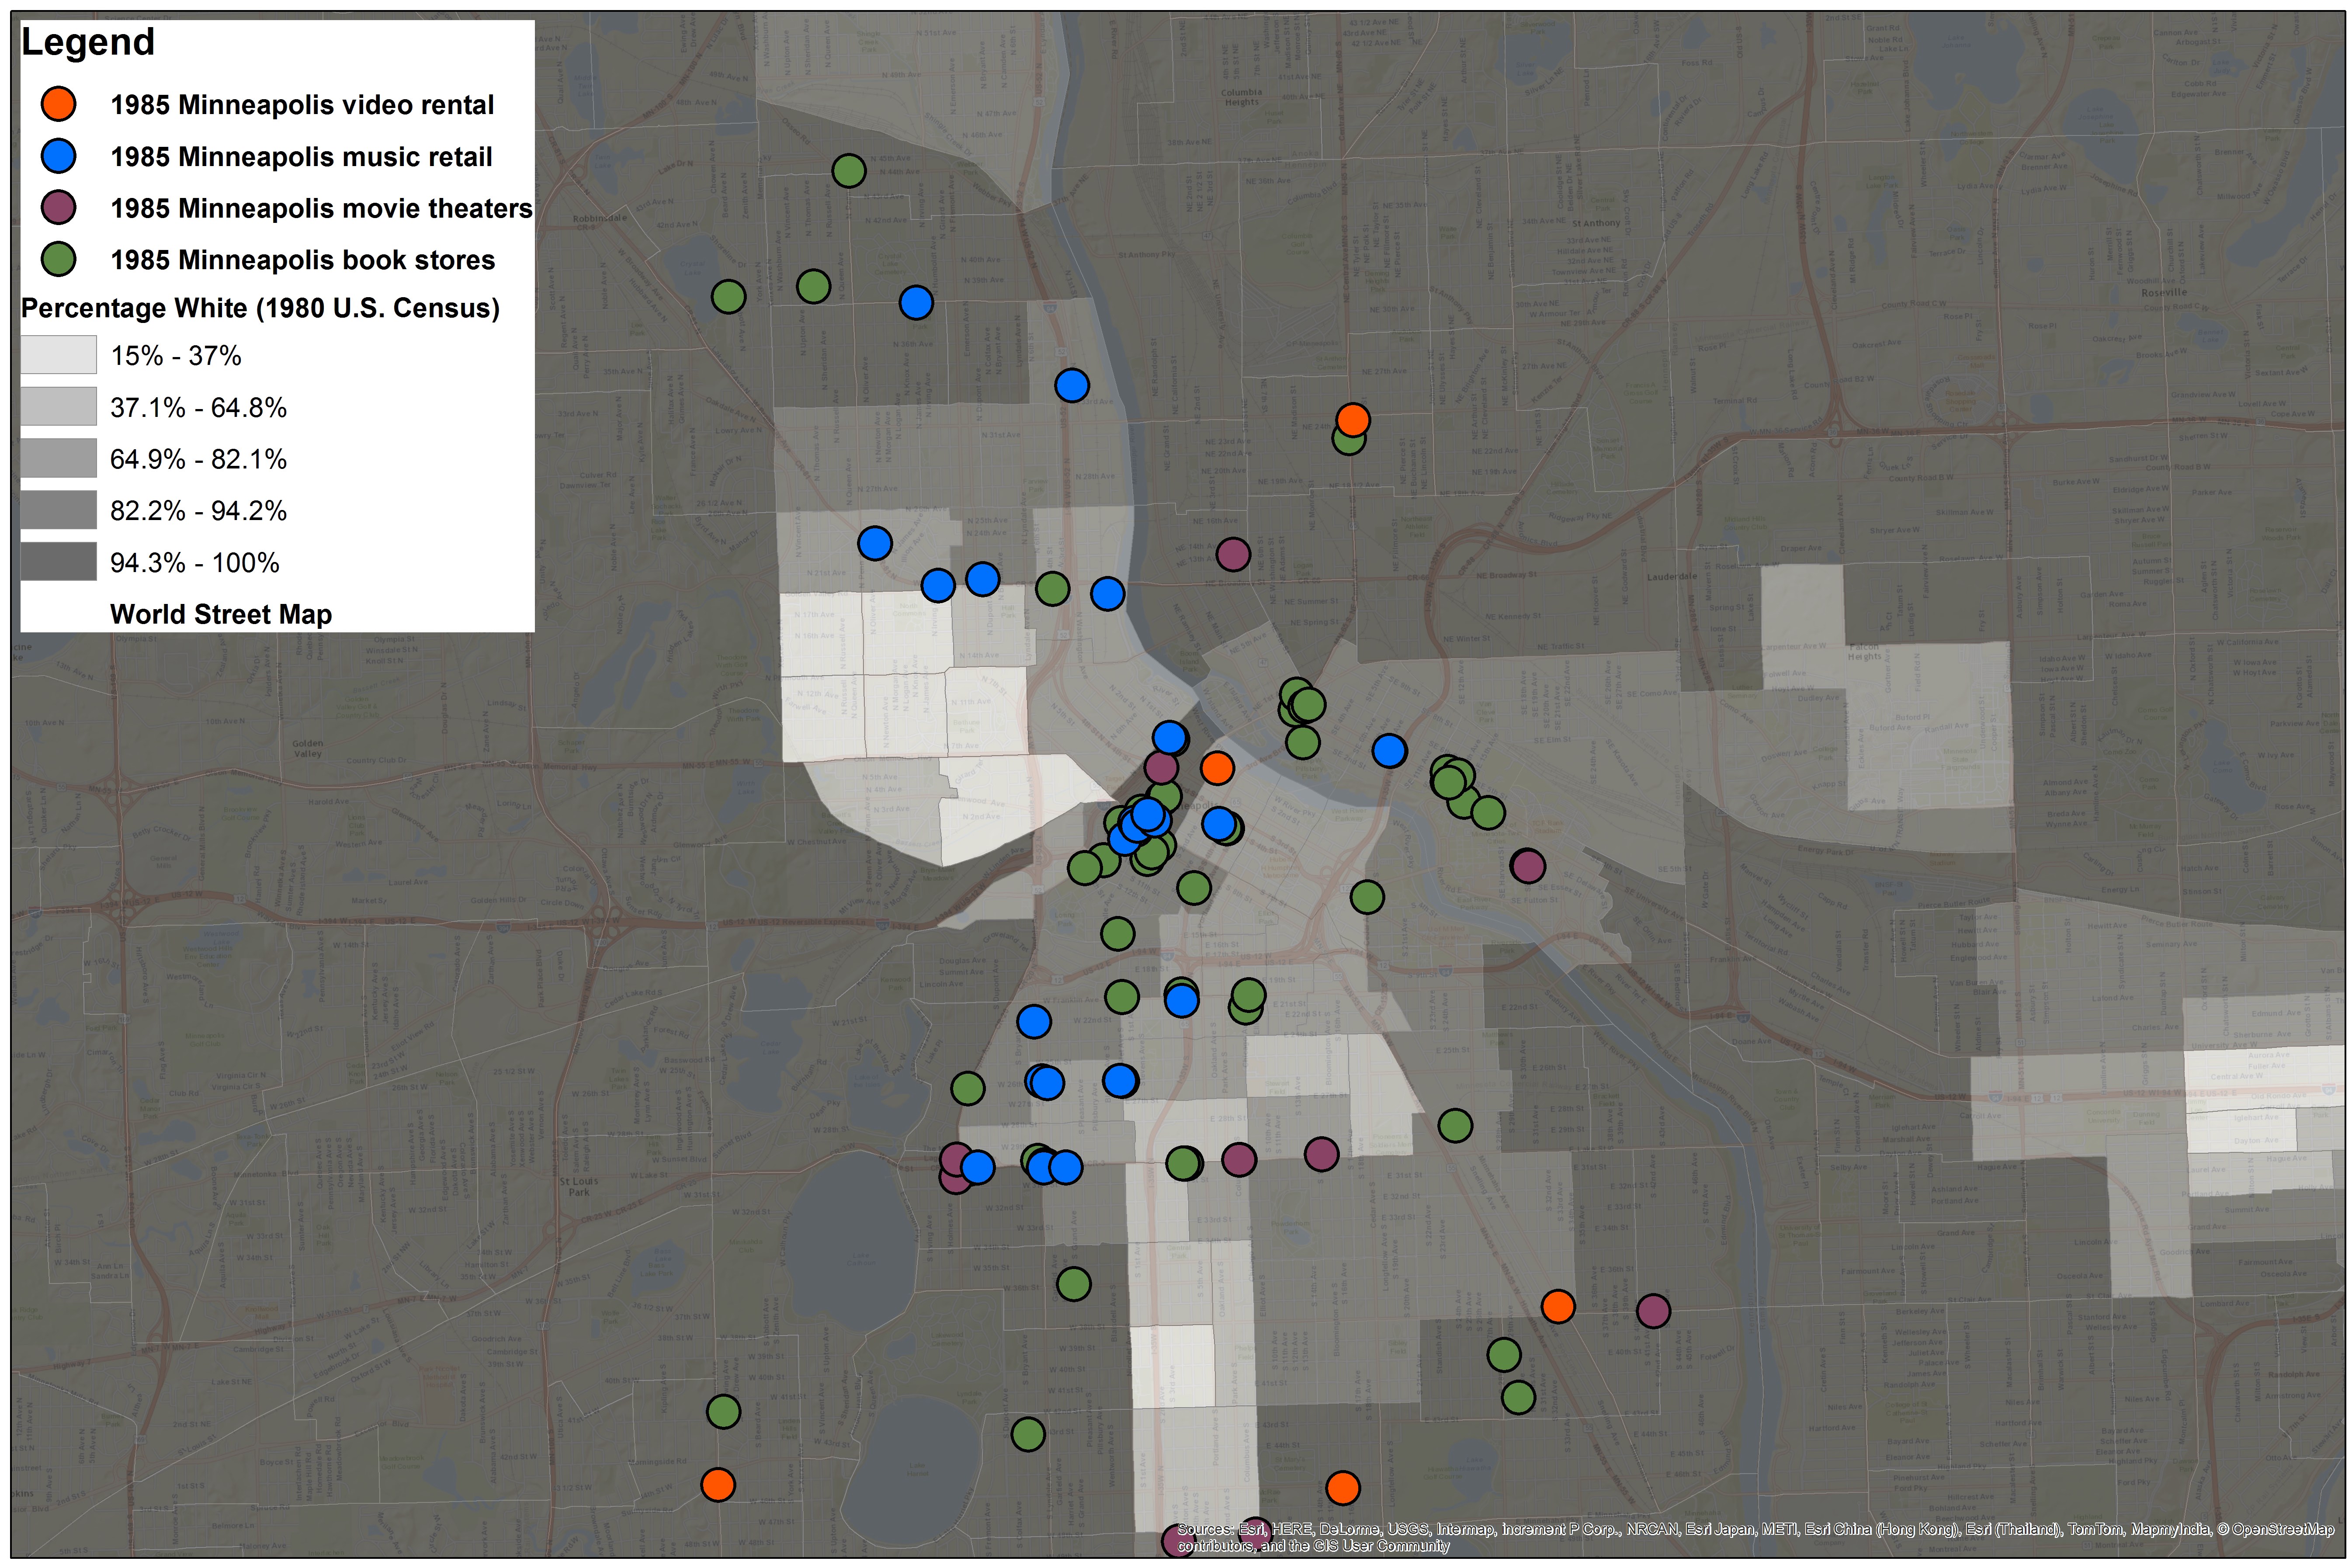
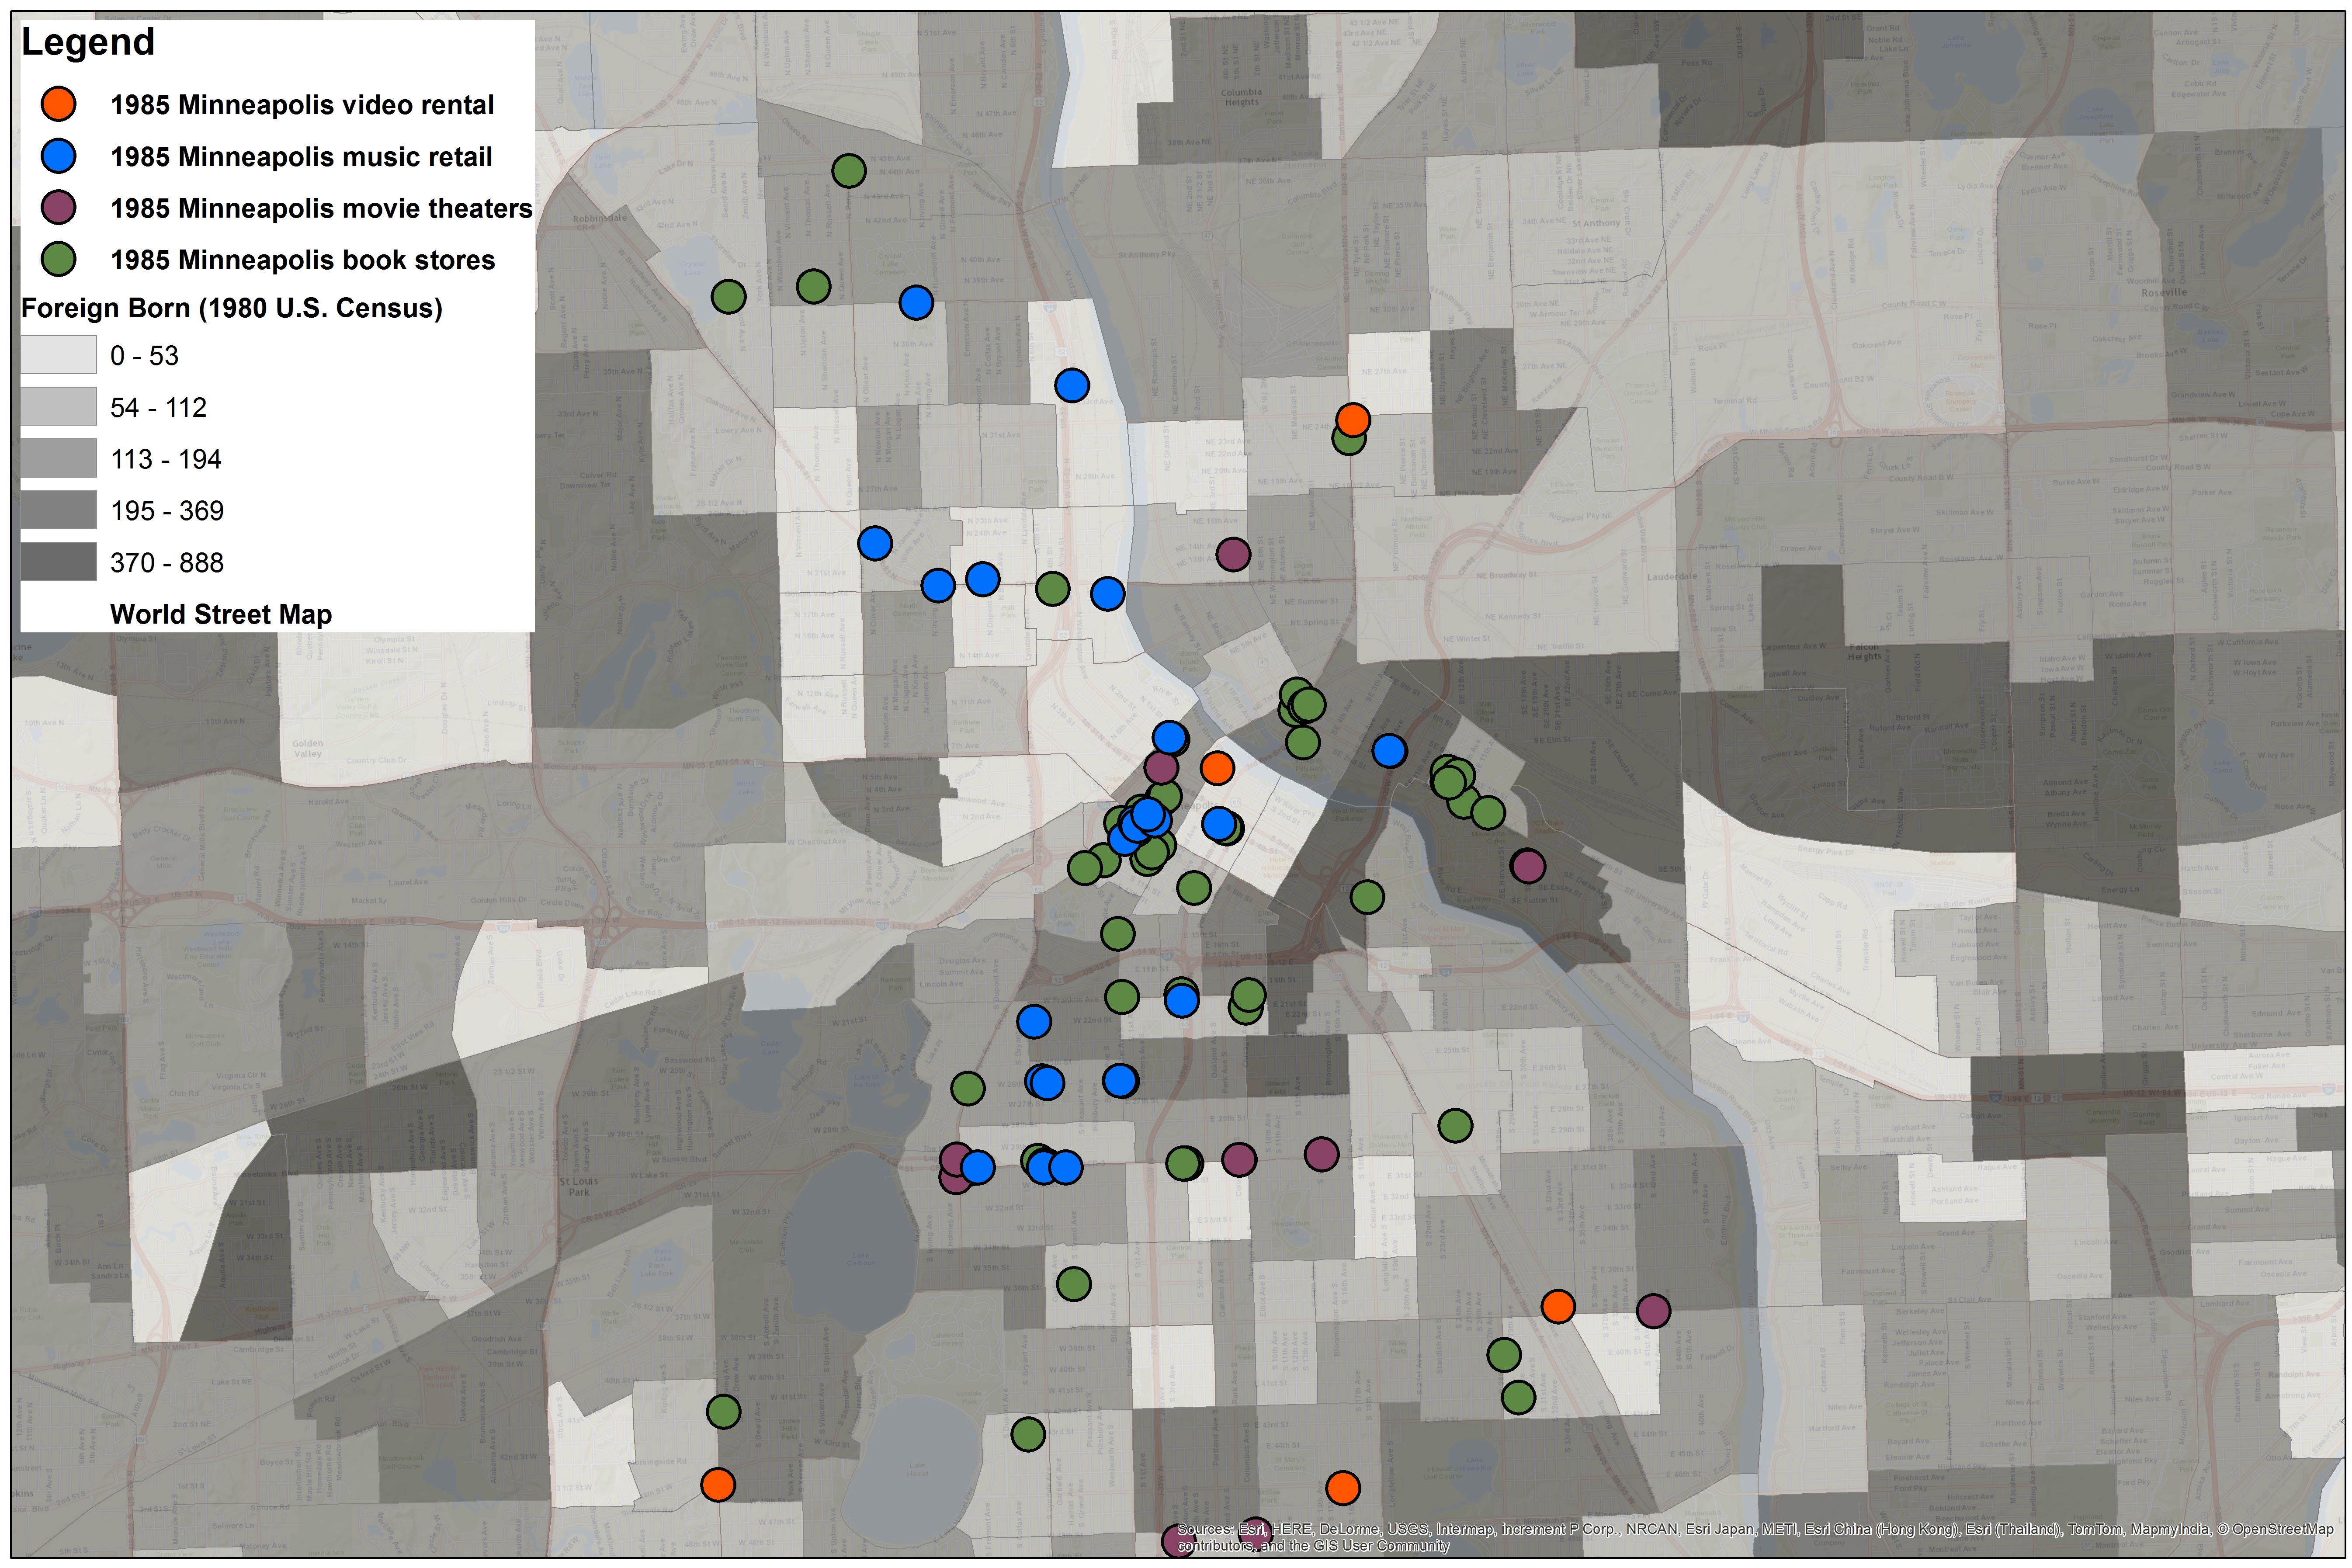
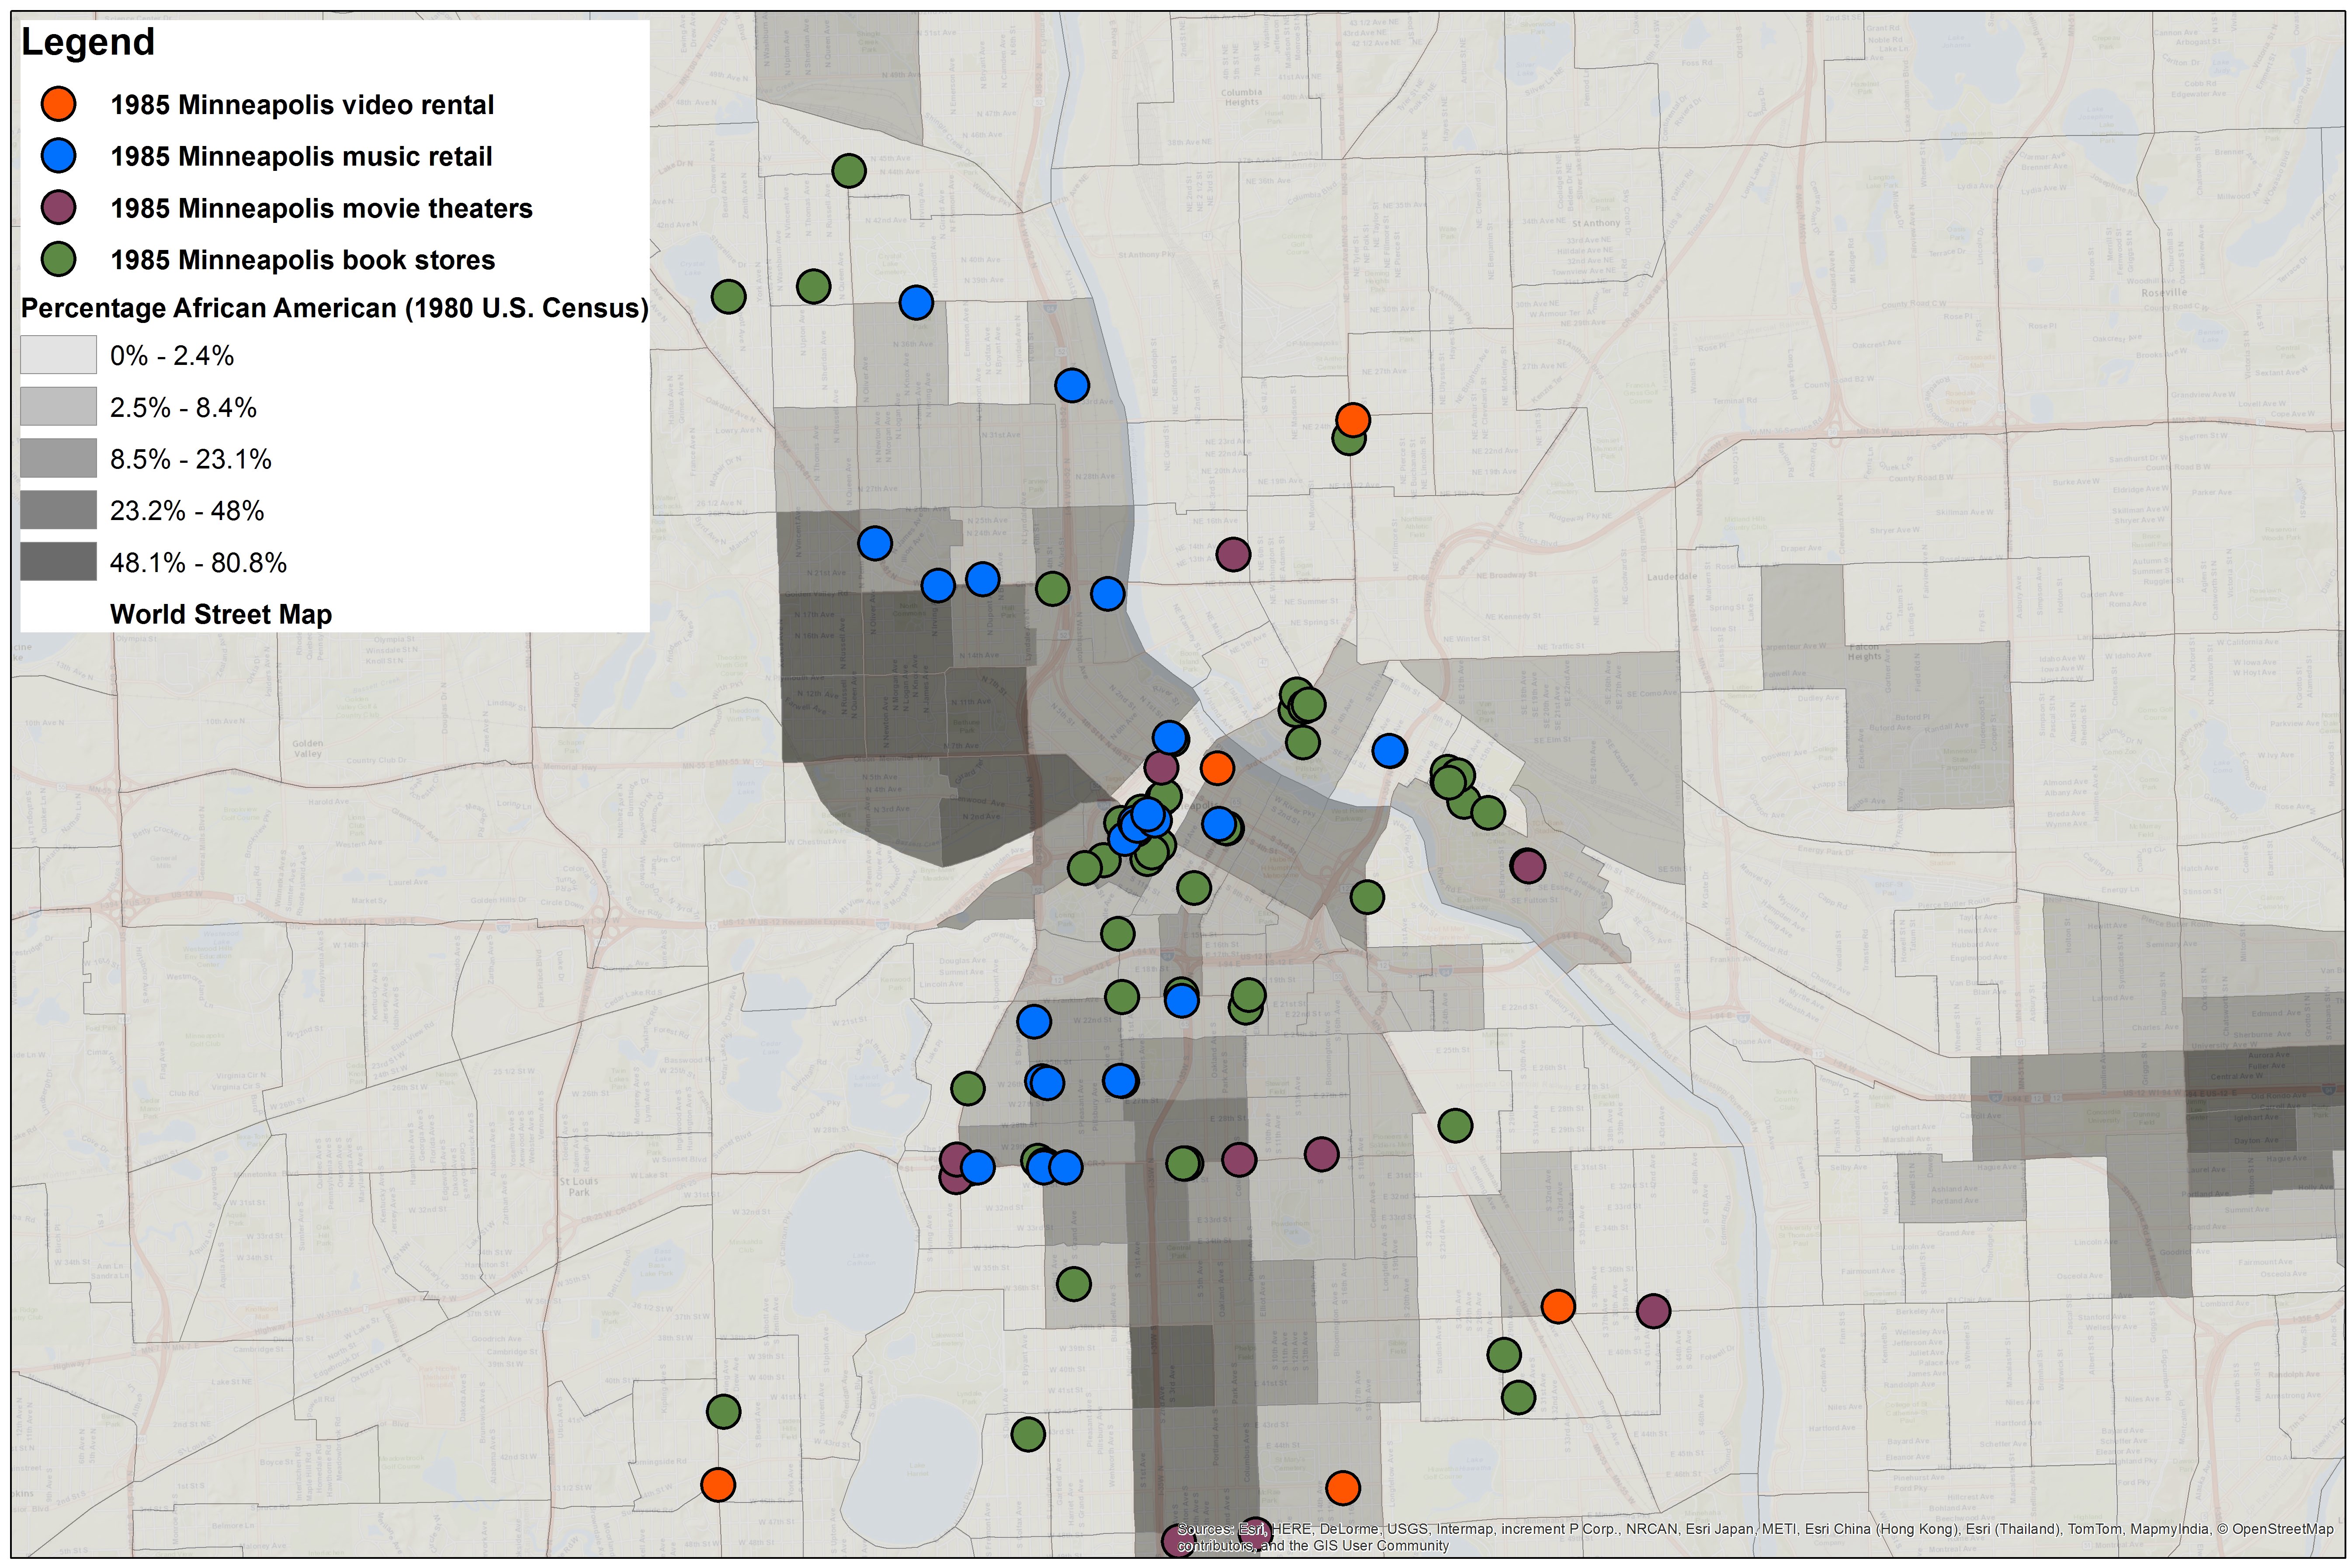
Beginning in 1985, the maps of Minneapolis indicate no clear correlations between the retail stores and most social characteristics, including population density, income, percentage white, or “foreign born,” which is the best category I could use from the 1985 Census to try to locate the Somali population (figures 2, 3, 4, and 5). One map (figure 6) does indicate that most of the retail sites were not in African American neighborhoods. All the maps reveal an impressive number of bookstores and record stores, most of which are in or near to the downtown area. Alternatively, the video stores are much more dispersed and more remote from downtown. One can imagine that these were the typical “mom and pop” shops found so commonly during the 1980s.
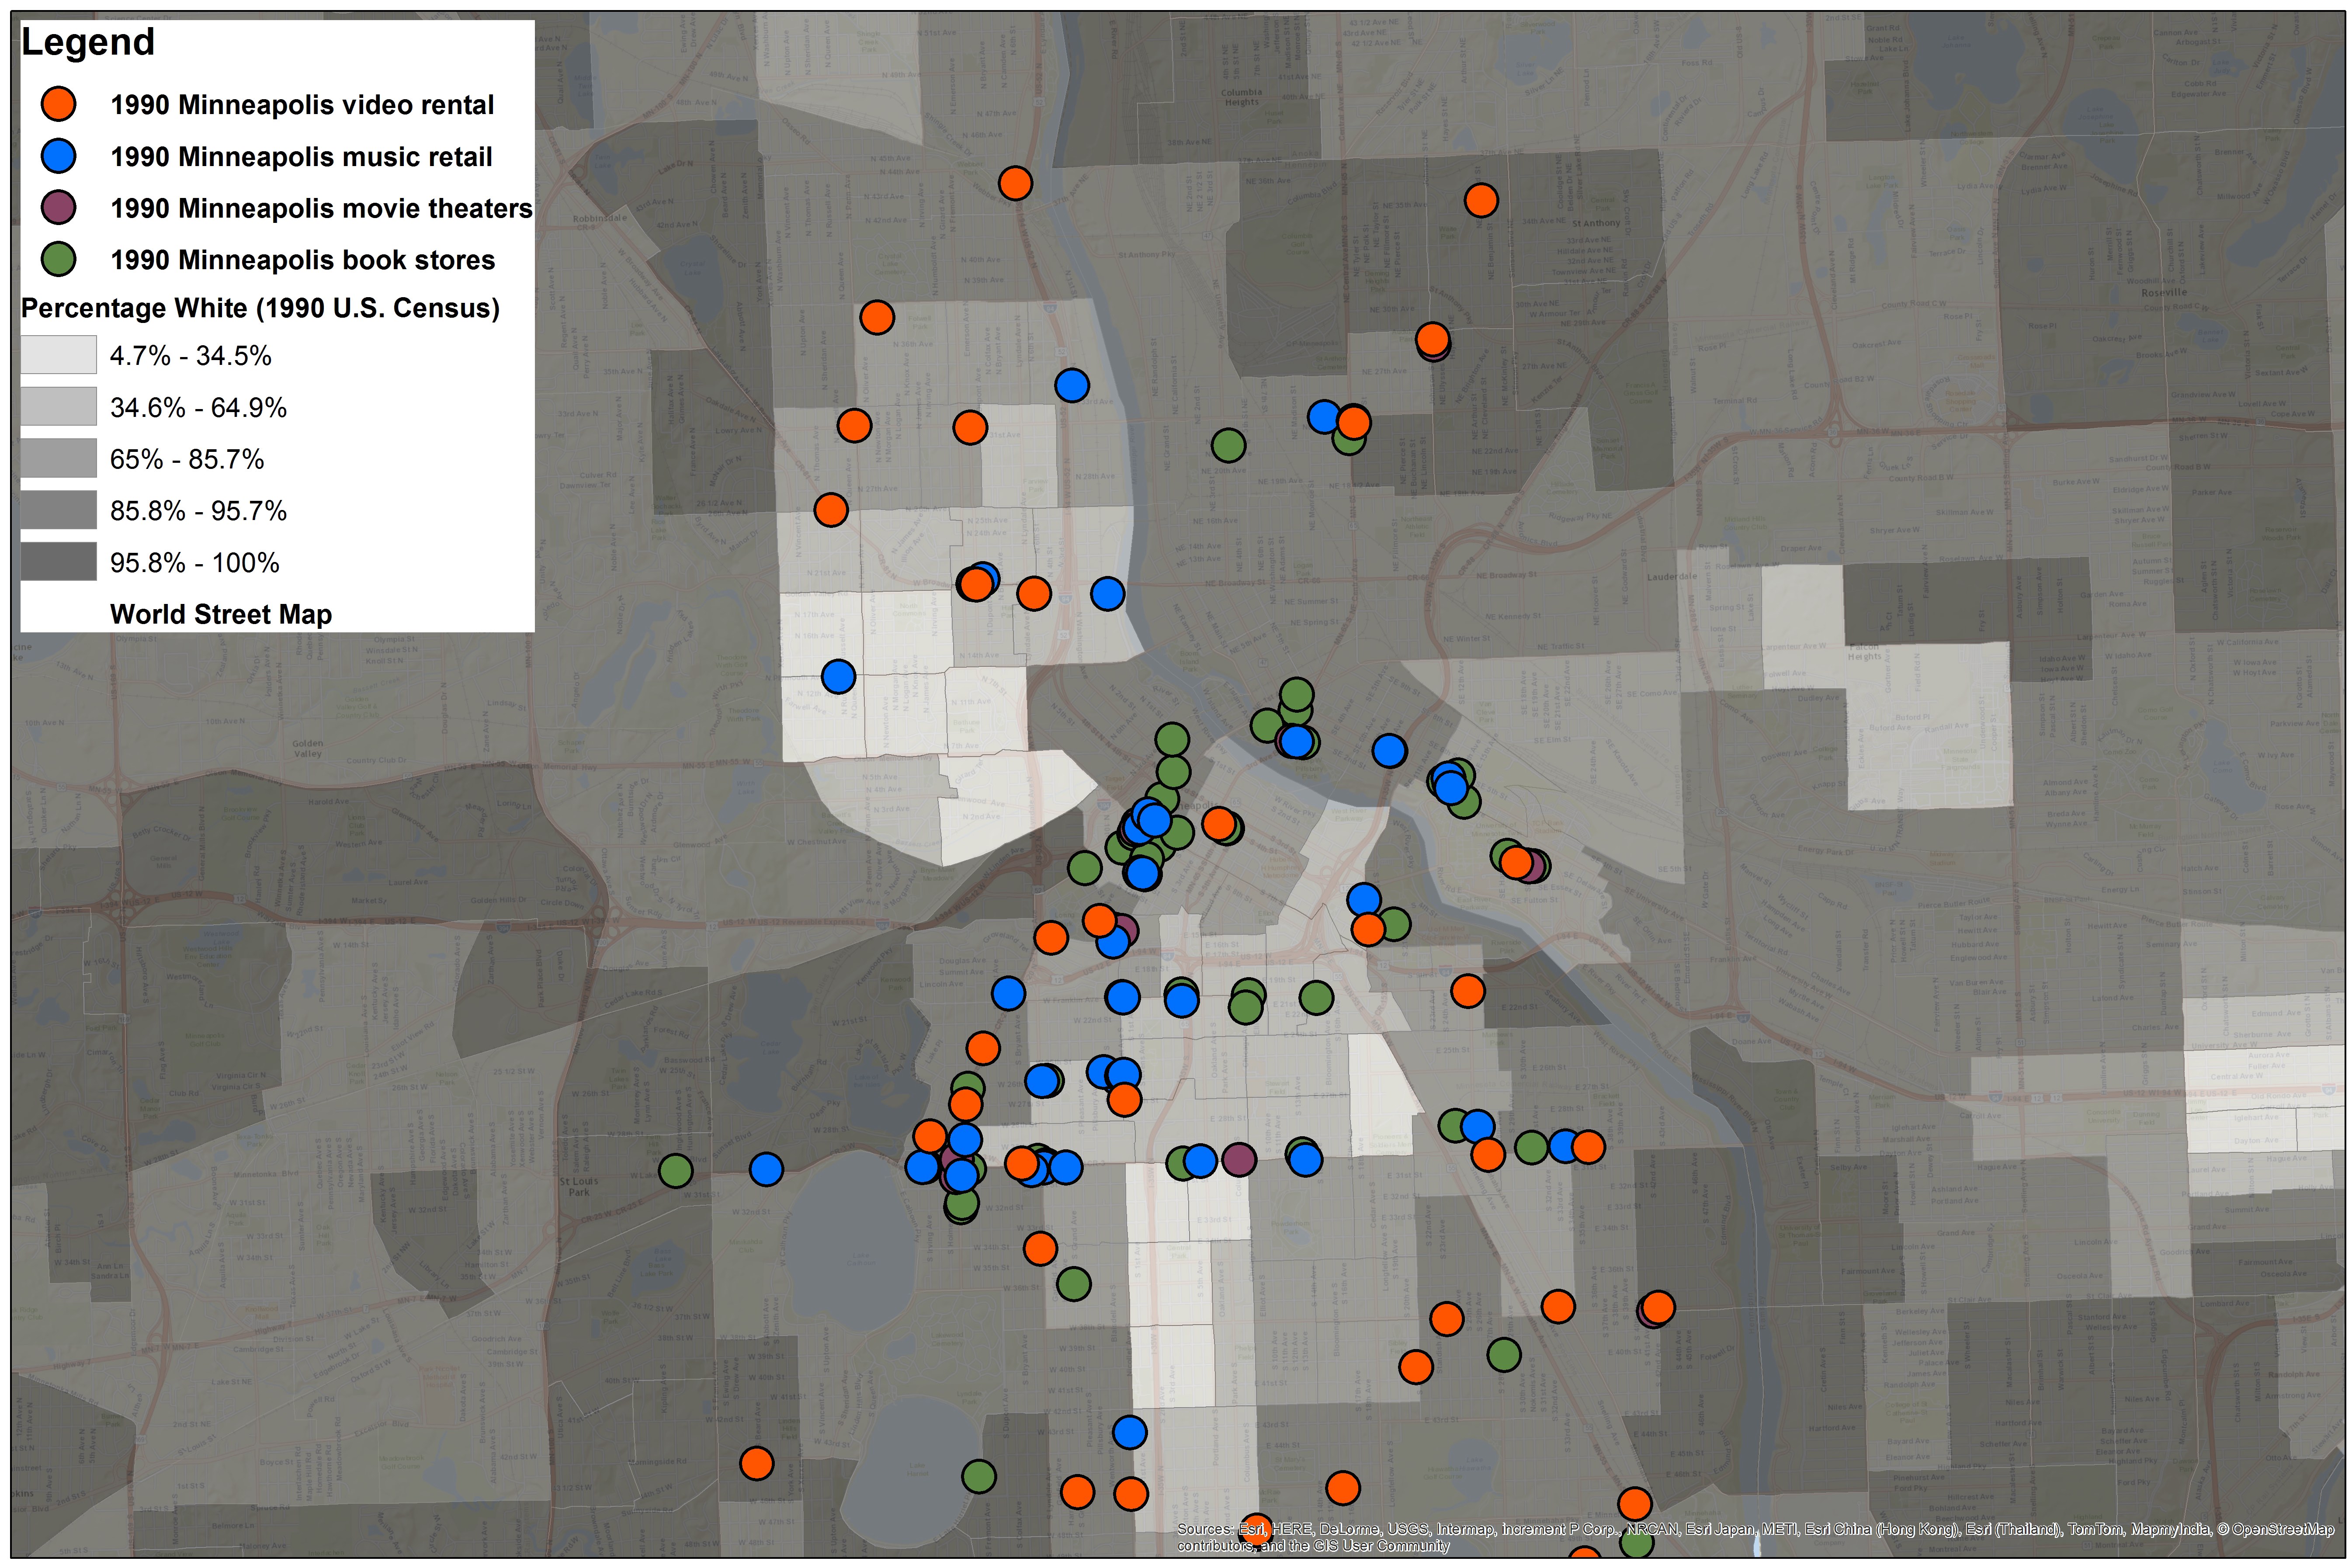
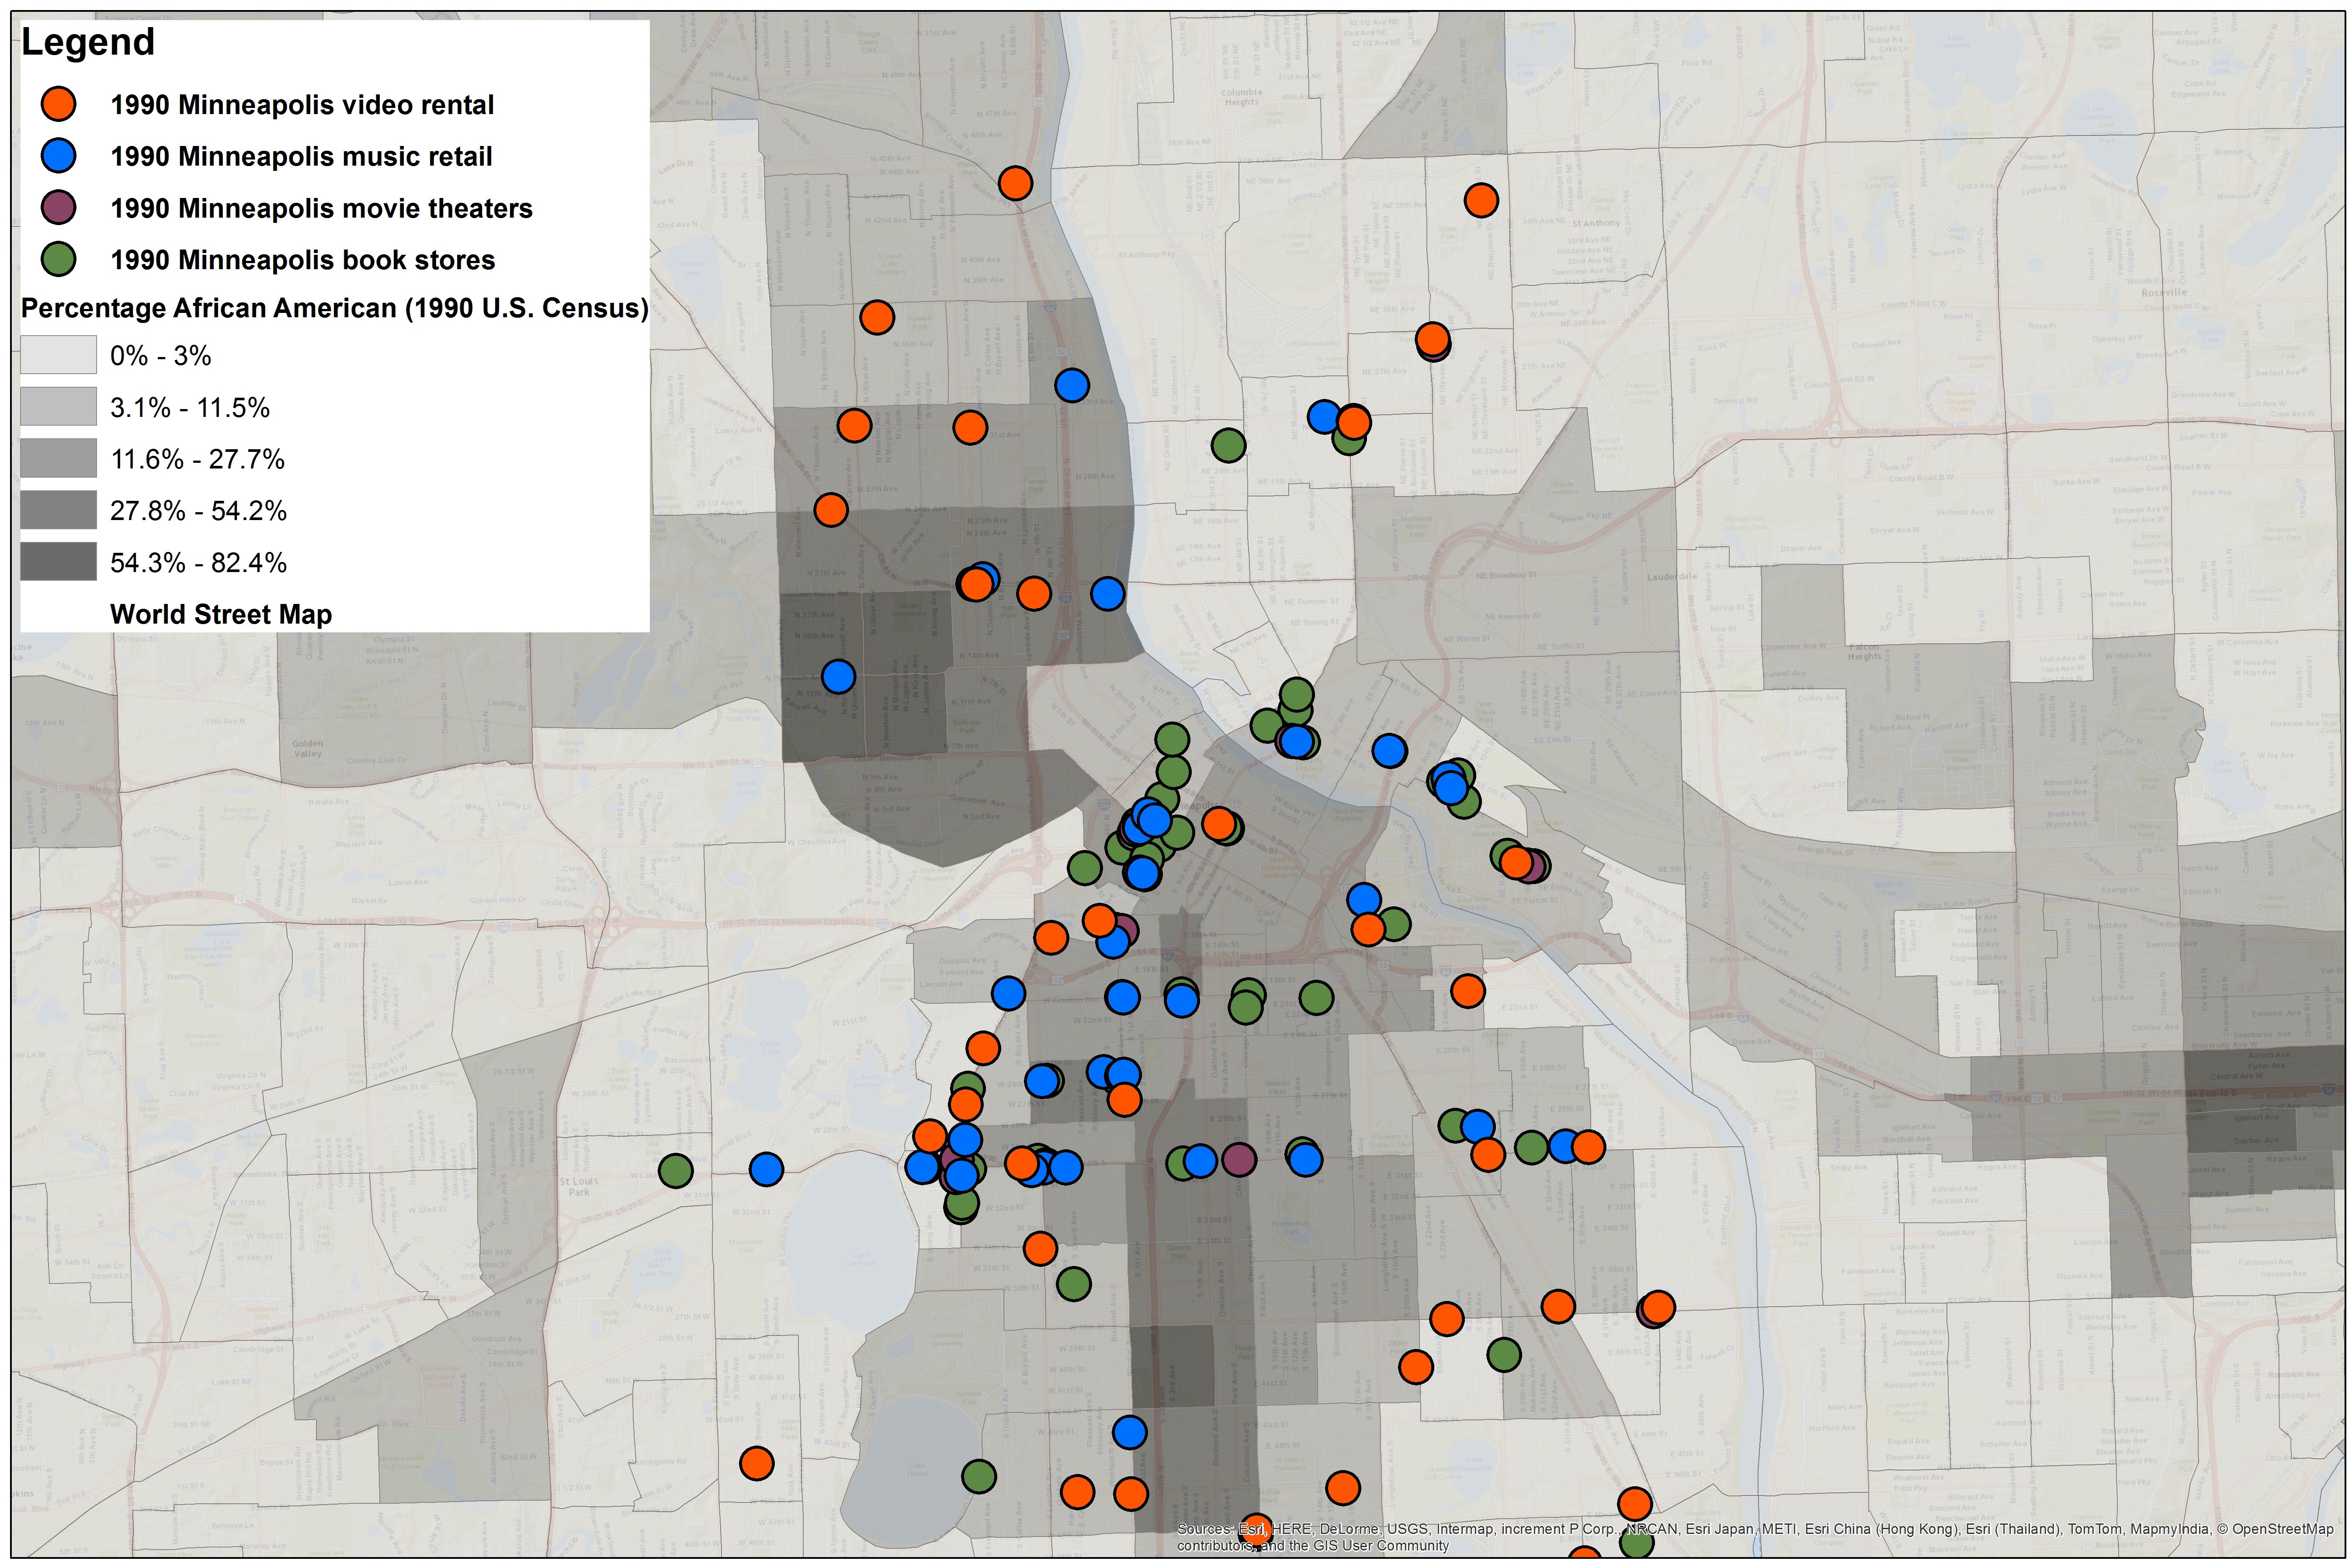
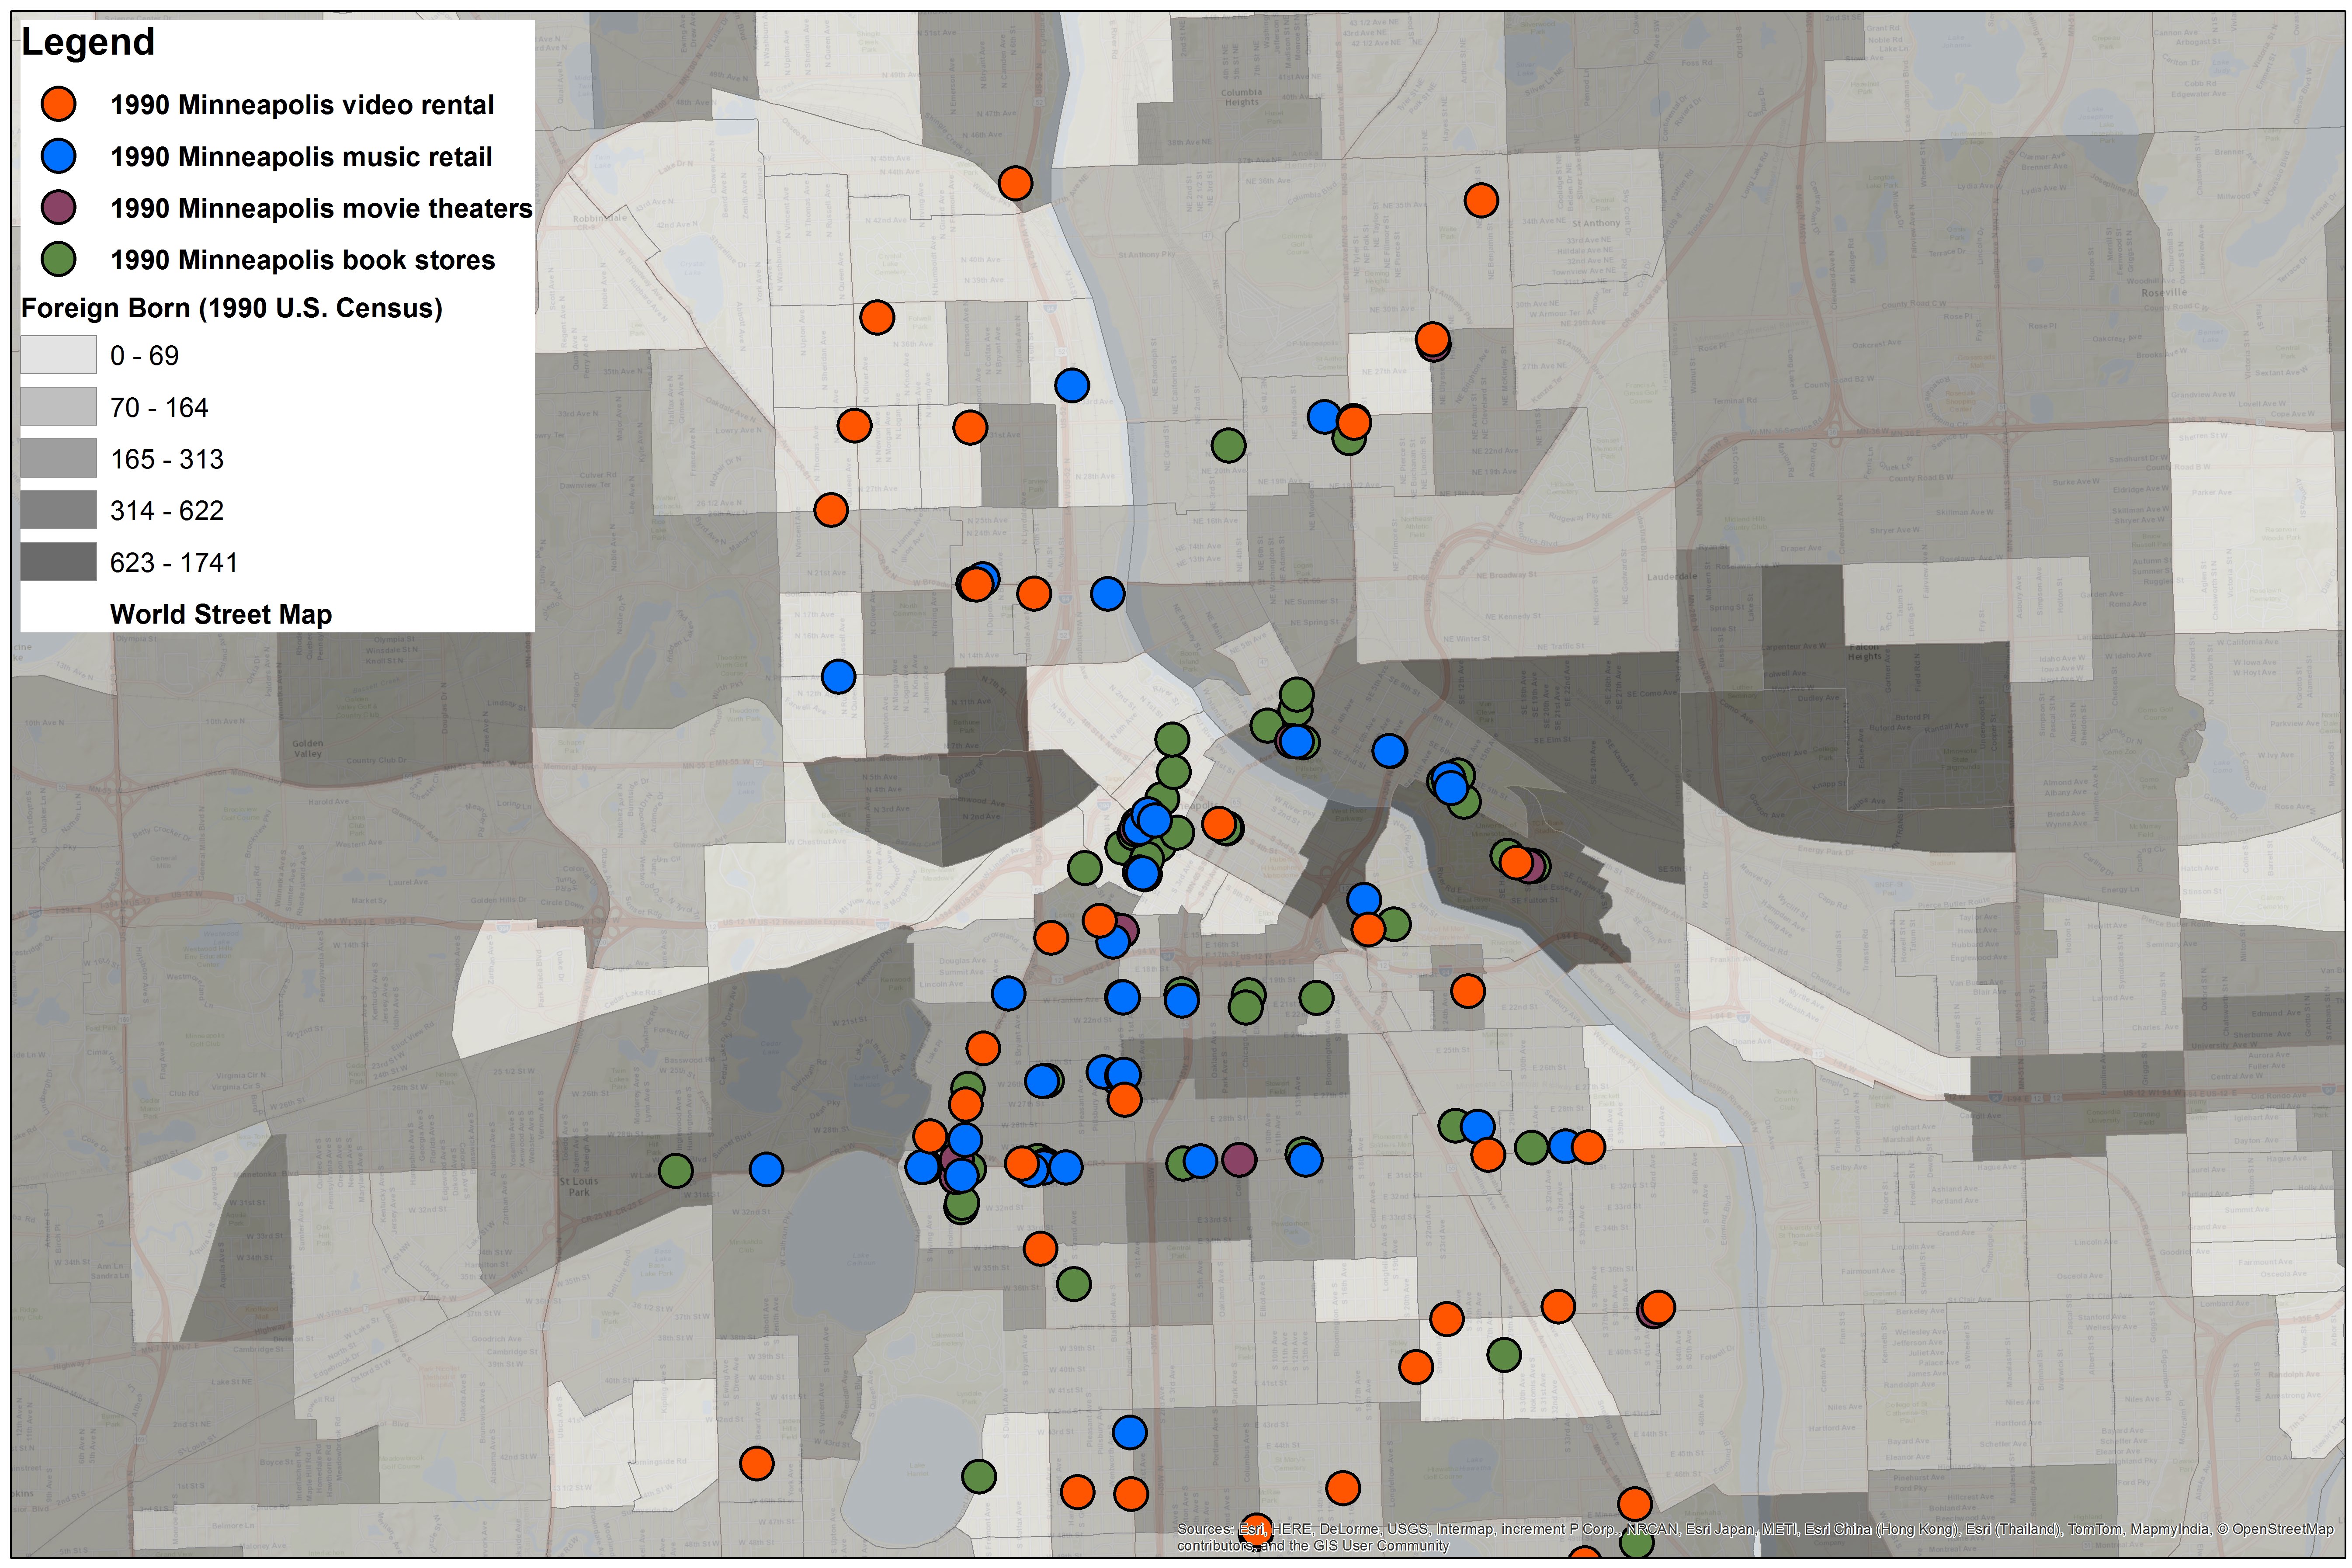
In 1990 we see some important changes and relationships (figures 7, 8, and 9). We now see a great increase in the number of video stores and that they remain more dispersed than other kinds of entertainment retail. Even more remarkable, to my mind, is the fact all the video stores and the great majority of the other stores are not located in African American areas, nor in non-white areas generally, nor in areas with large “foreign born” populations. Entertainment retail, and video rental in particular, appears to be a white, non-diasporic enterprise.
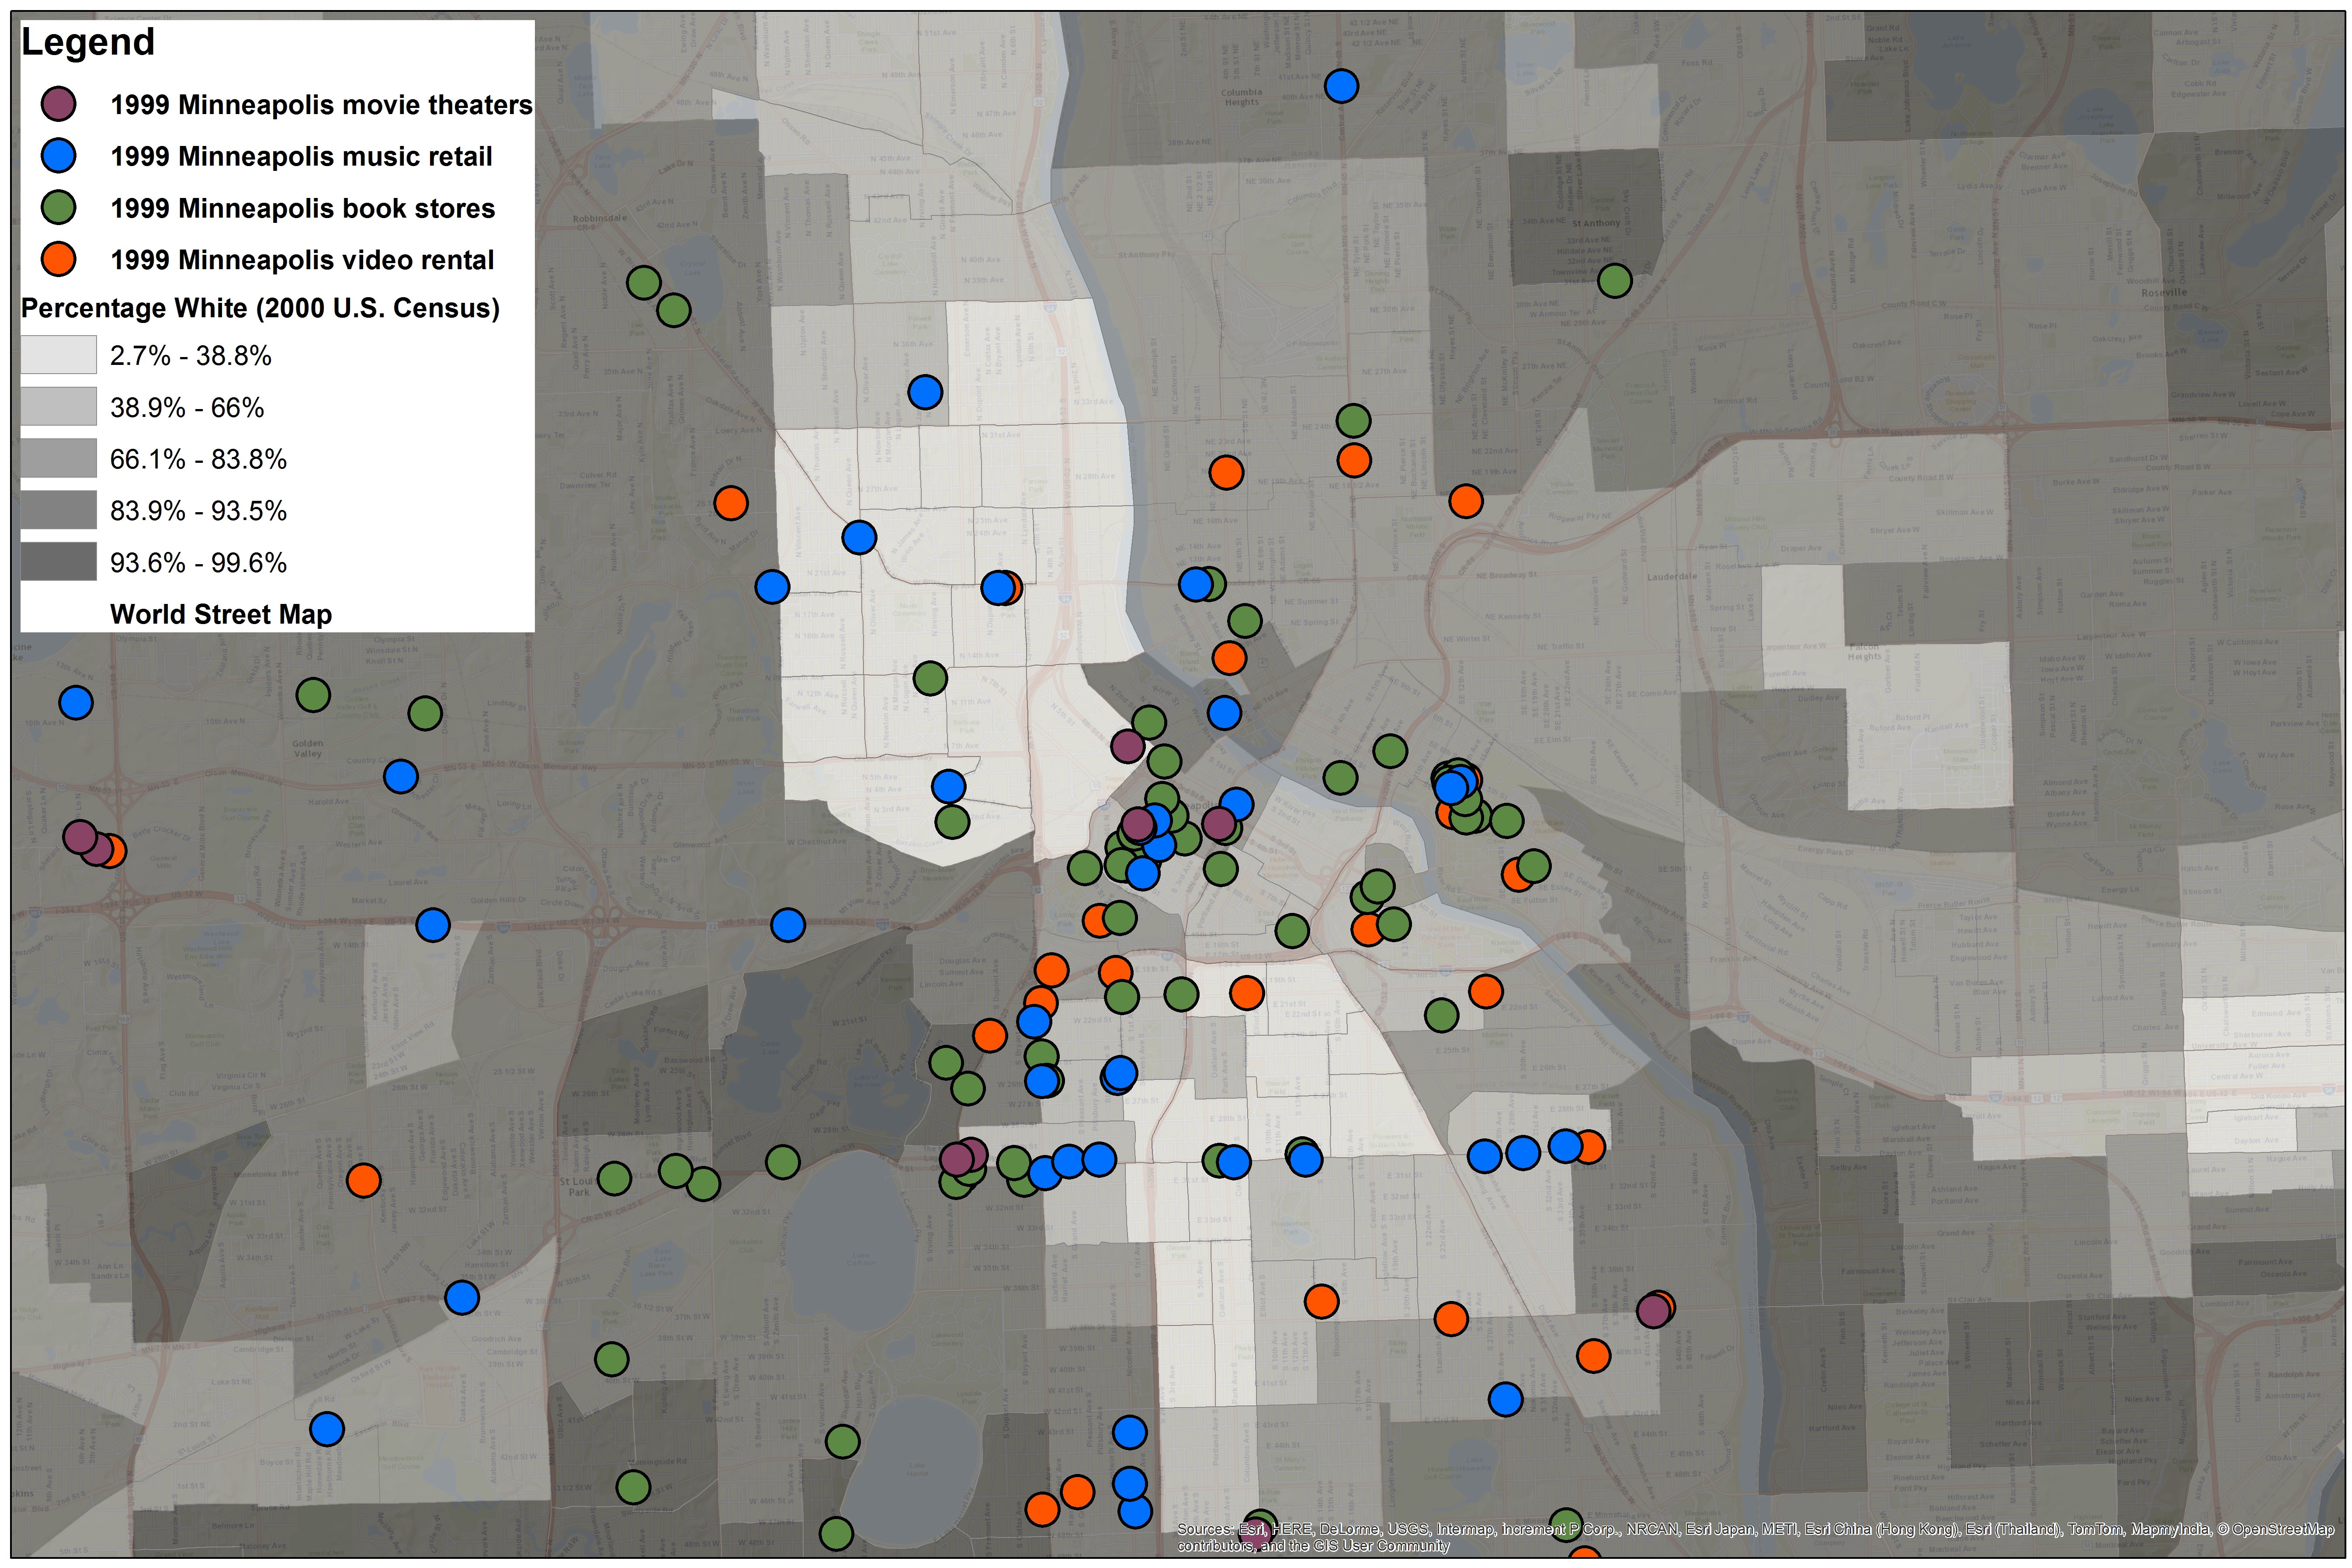
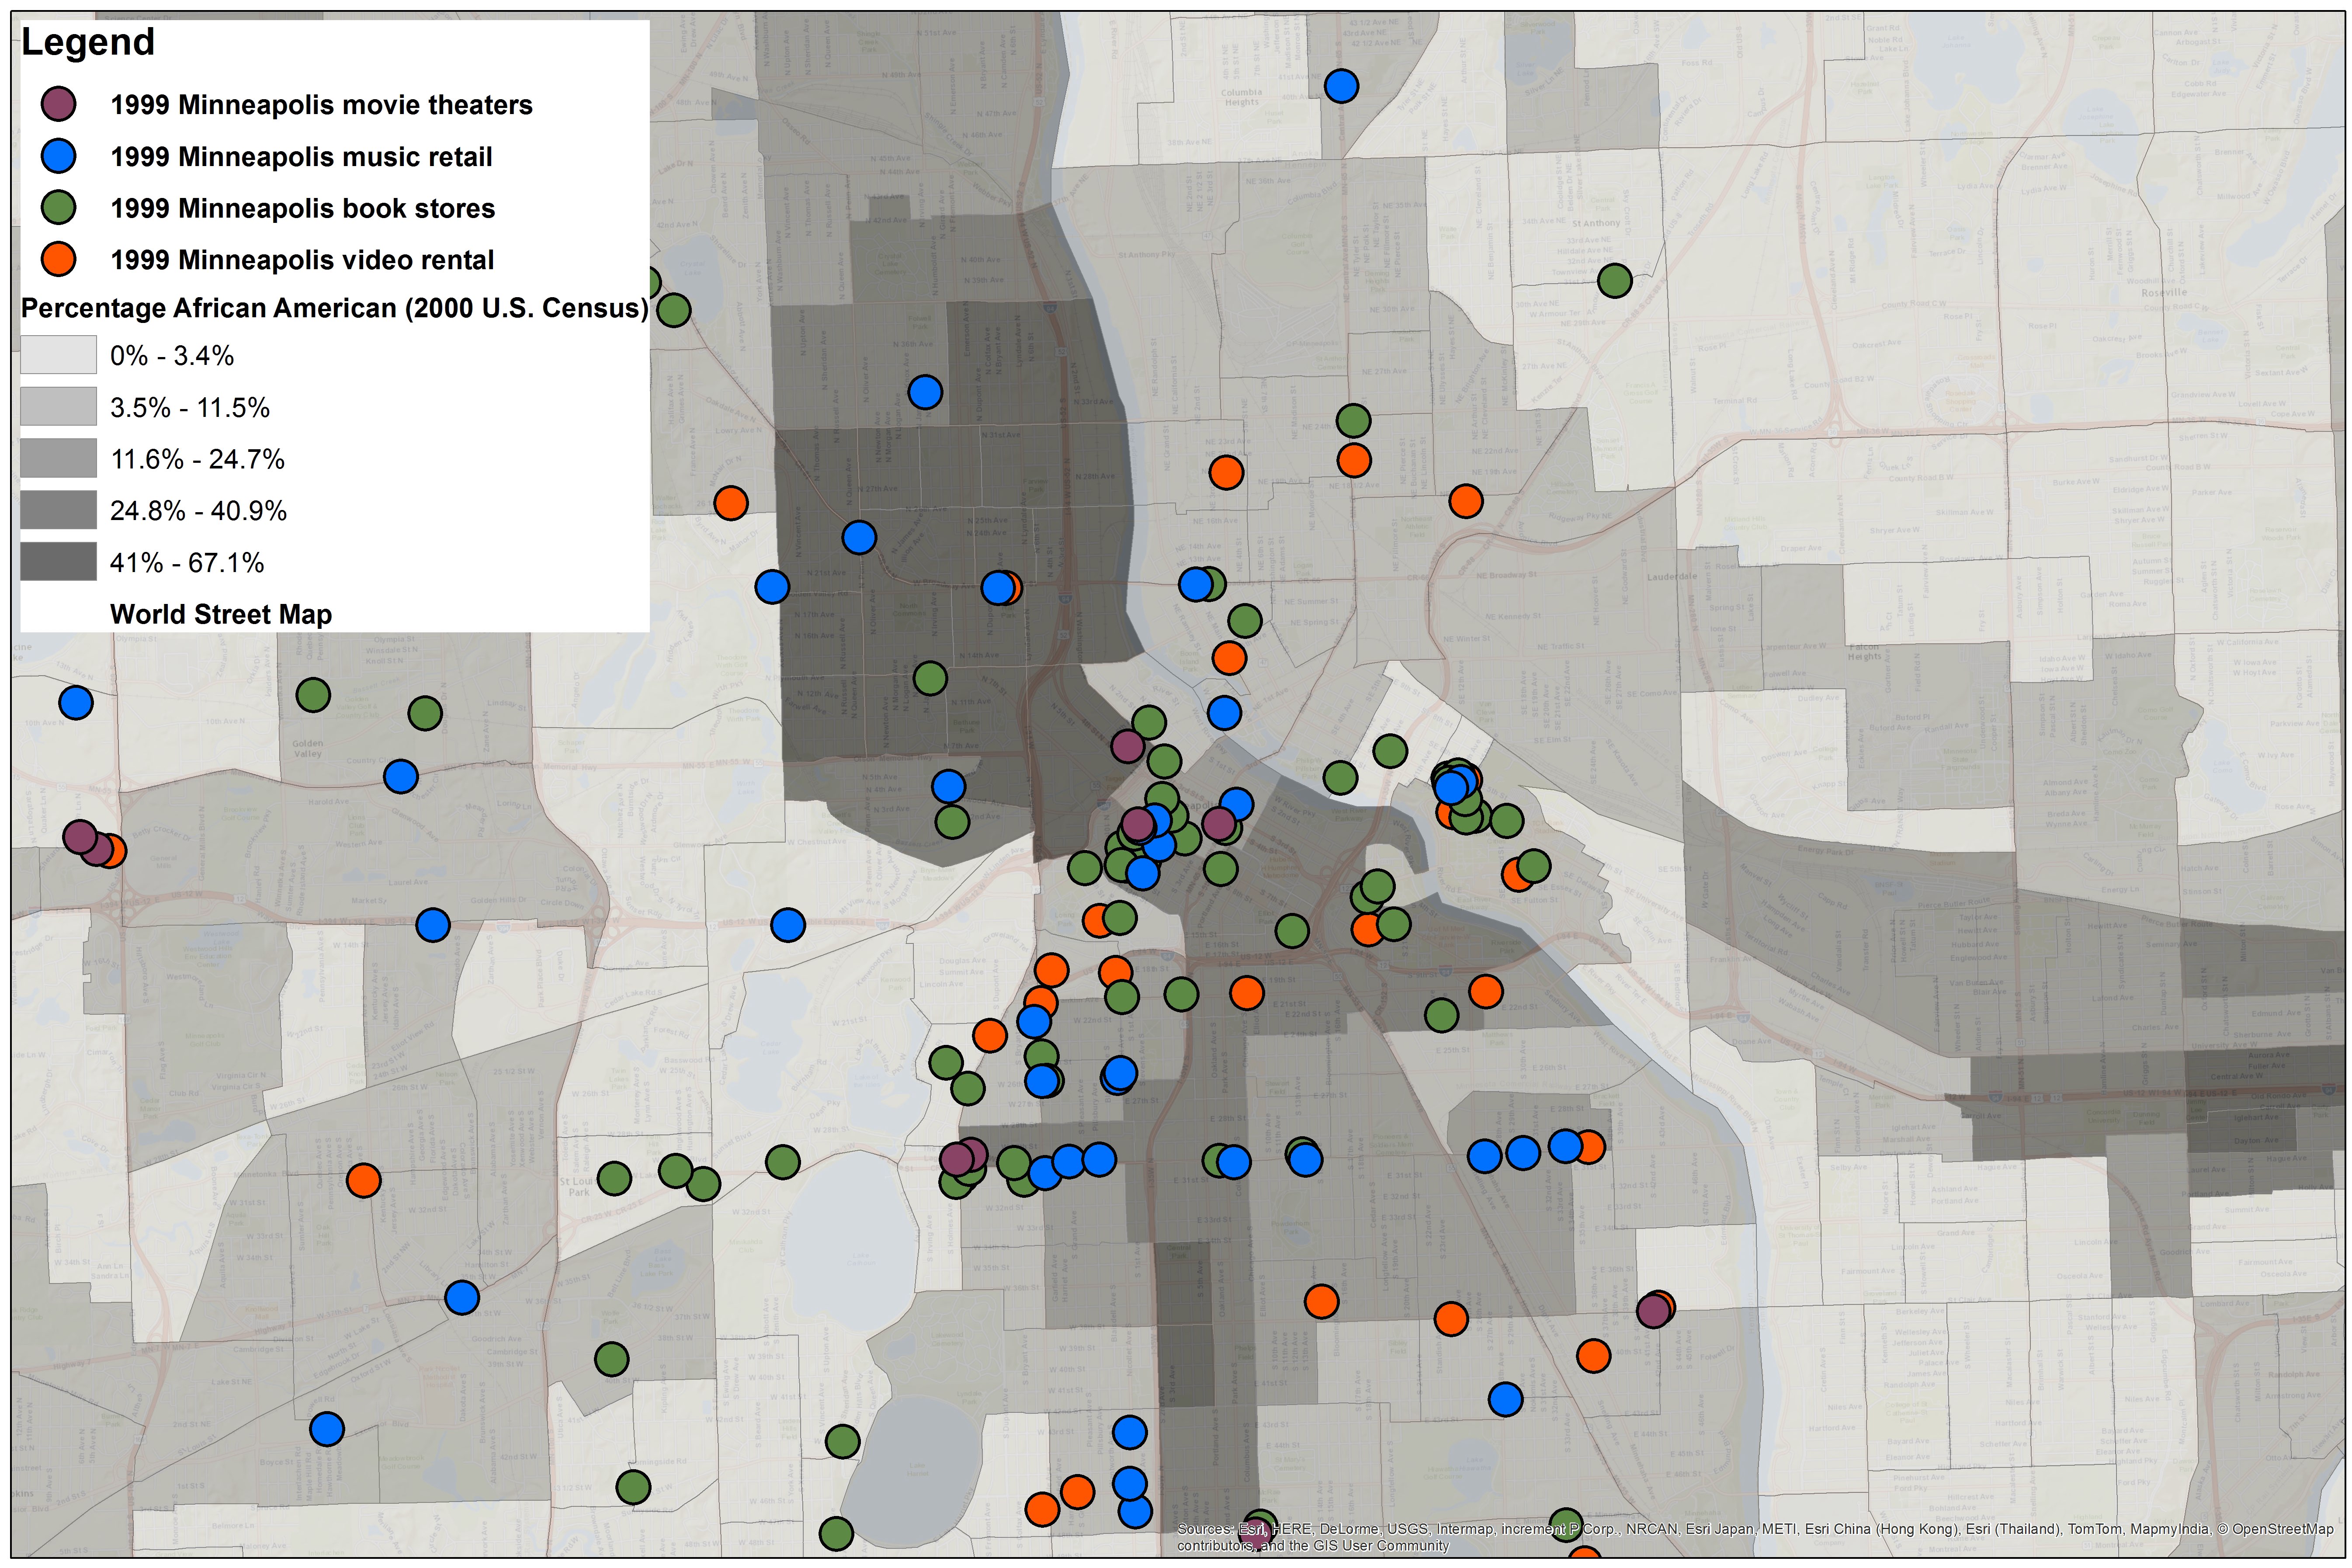
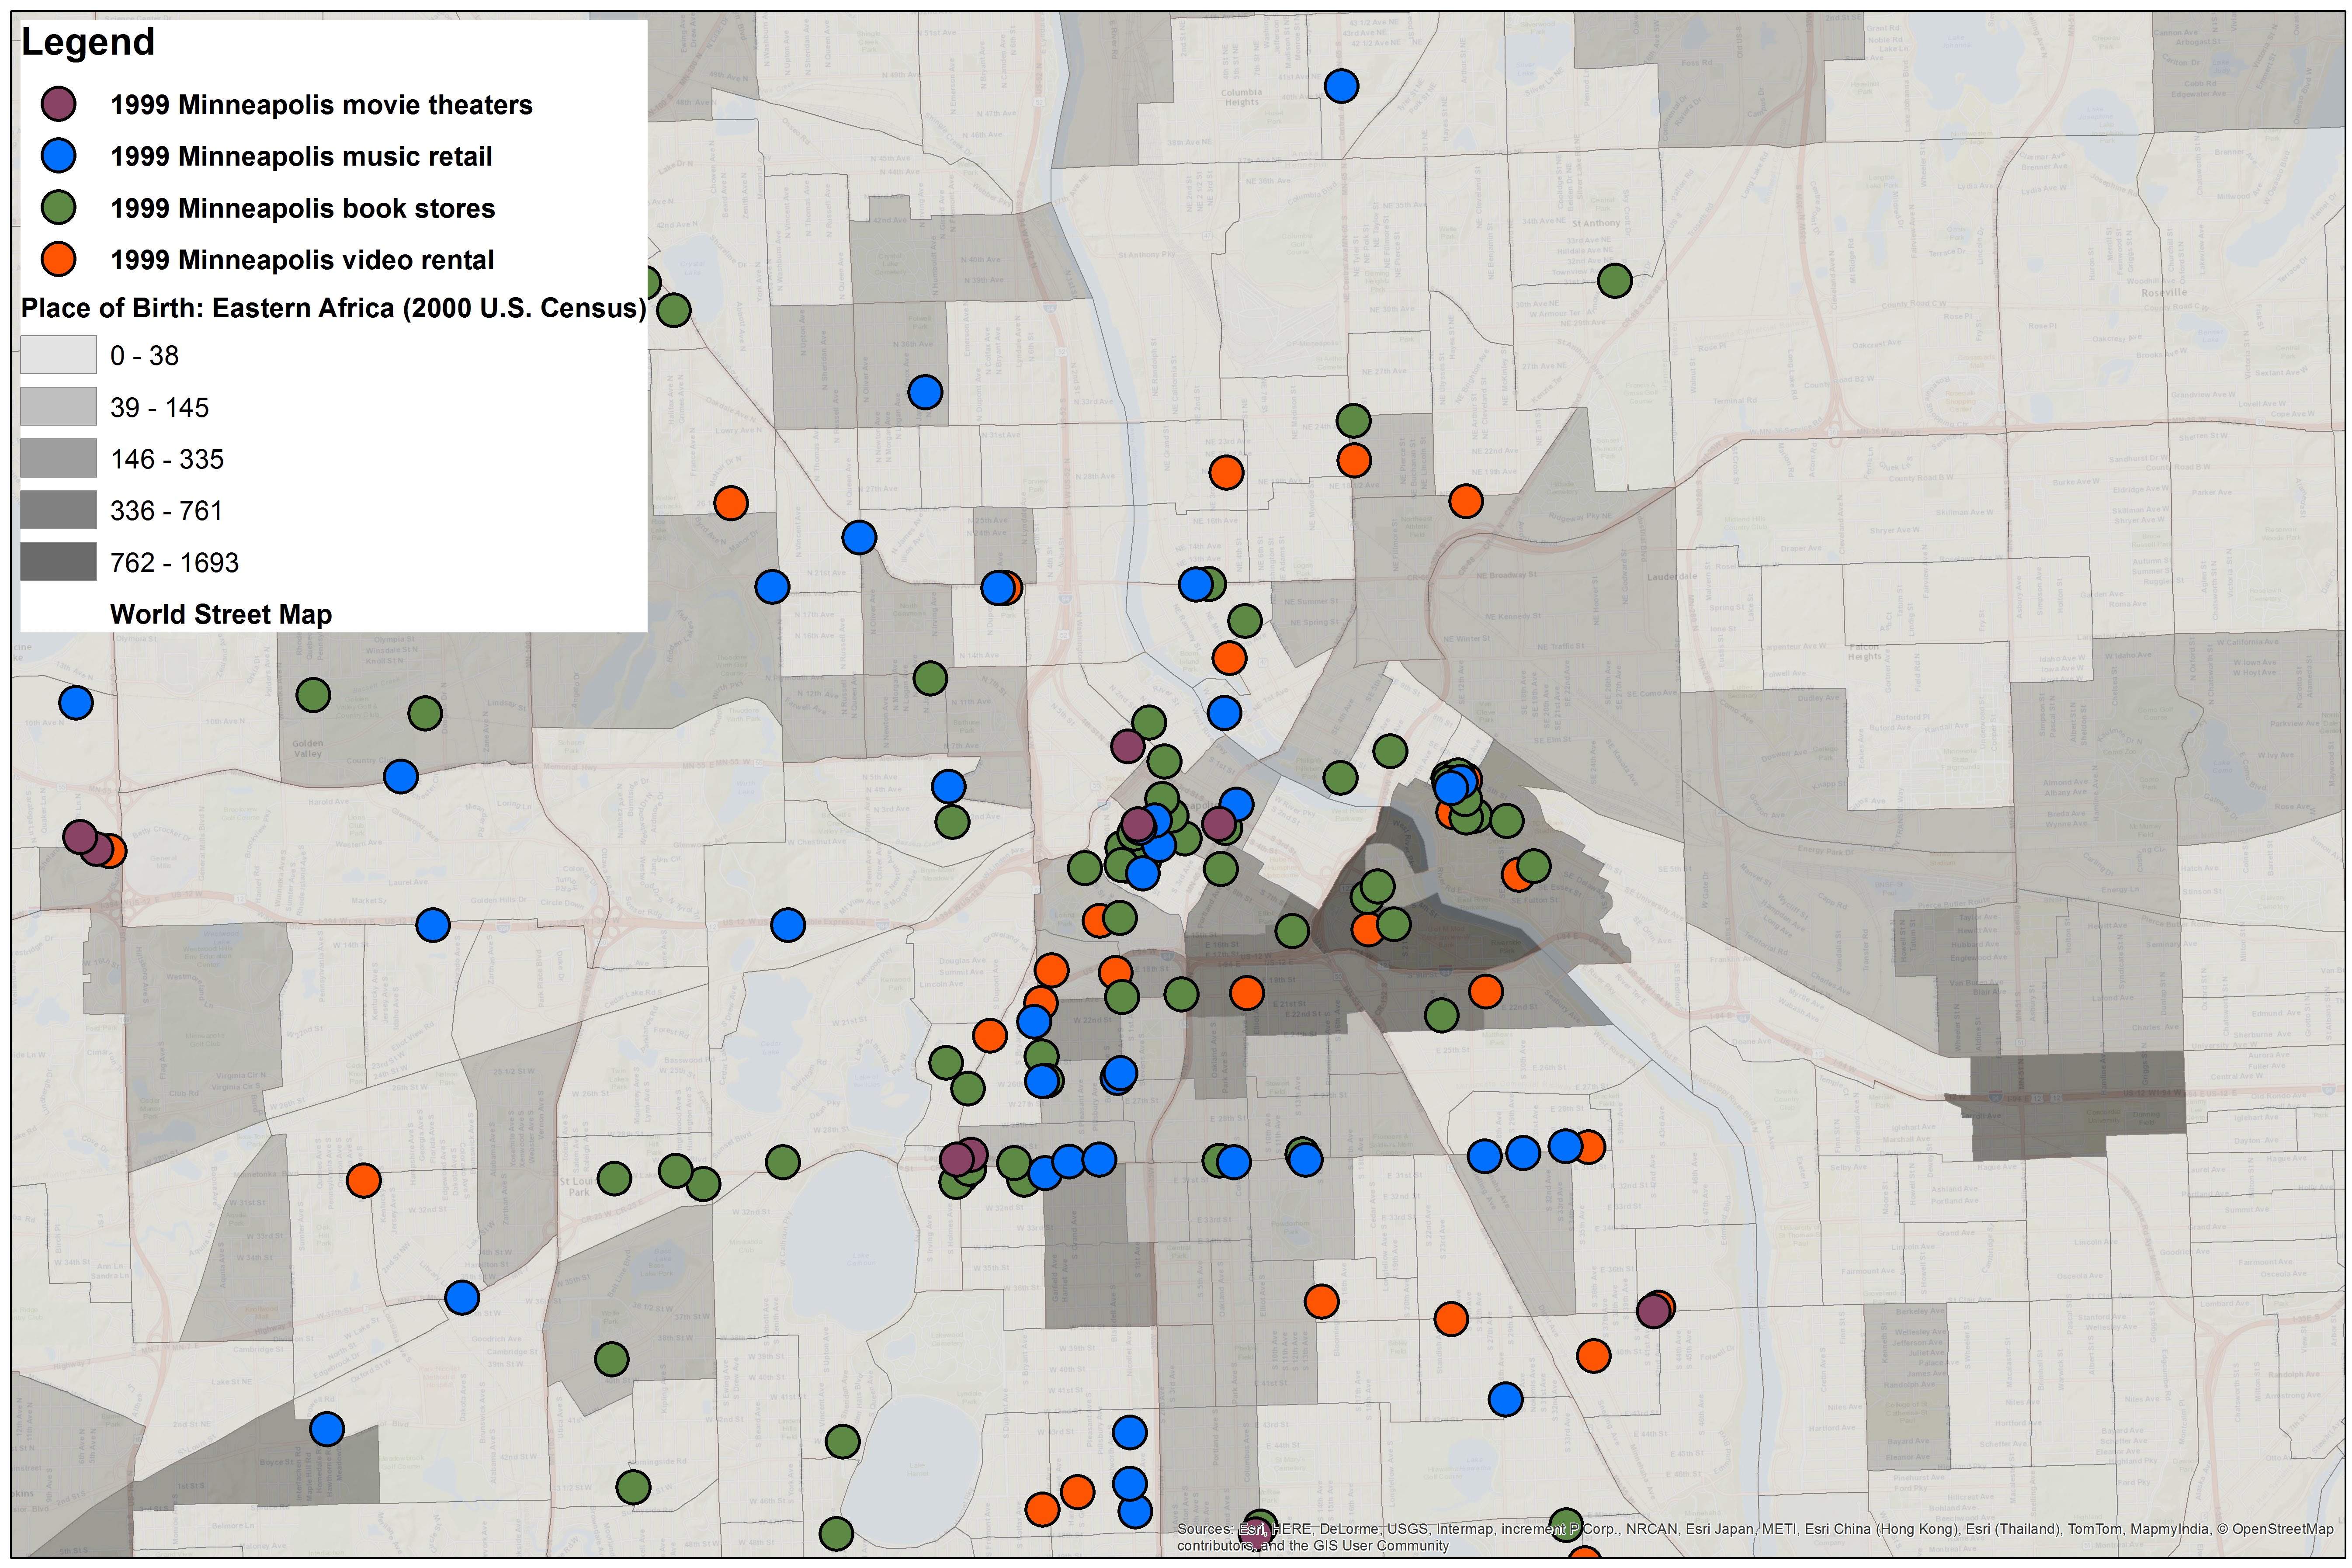
As in 1985, the maps for 1999 do not present any clear alignments between the location of entertainment retail sites and the location of African Americans or white people, except for video stores, which still appear in mostly white neighborhoods (figures 10 and 11). By this year, the Census had a category for “Place of Birth: Eastern Africa” (figure 12). And indeed, the map indicates a concentration of Somalis in what is called the “Cedar Riverside” neighborhood, just to the east of downtown. Although there is not a sizeable cluster of retail sites in this area, there are three bookstores and a video store, making one wonder if they catered in material for the Somalis in that area.
This map from 2015 shows that there are two video stores in this area (although one had closed by the time of my visit), and that one of them is called “Intercontinental Video” (figure 13). City directories and telephone books indicate that this store had been open since 1982.
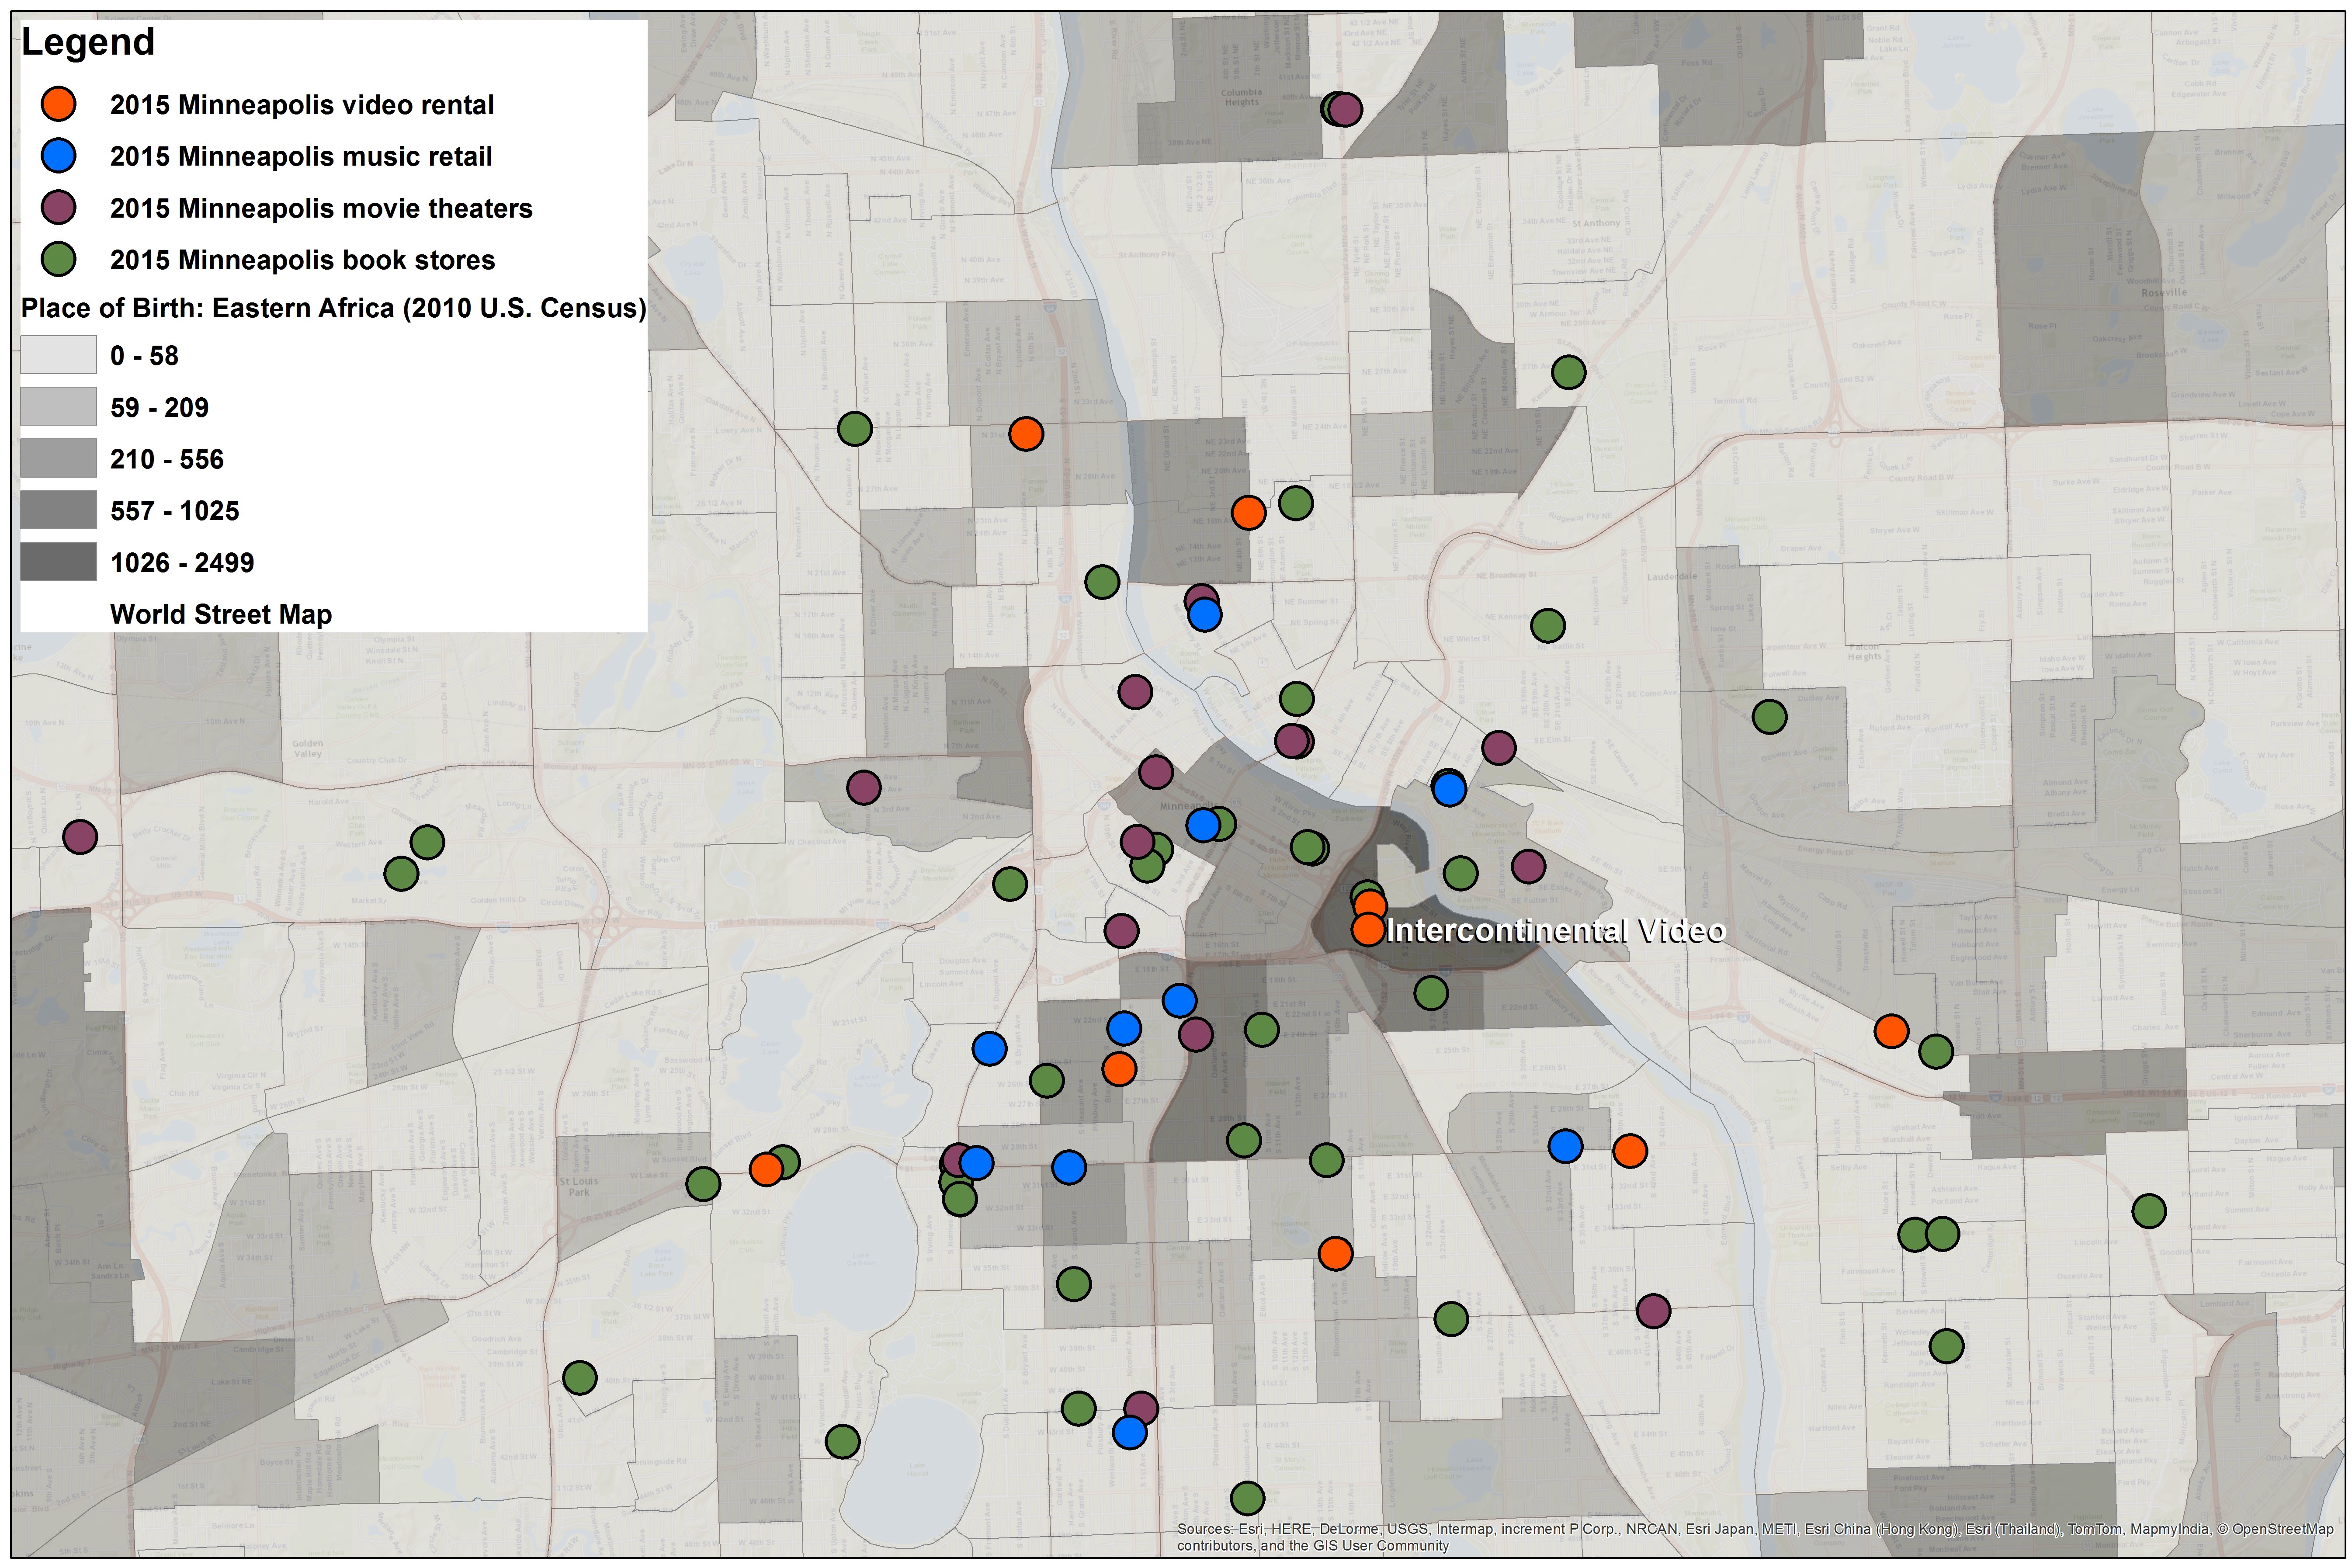
This map and the name of this store would suggest a strong relationship between the store and the local community. But the truth is more complex. I visited Intercontinental Video and discovered that it is owned by a 78-year old man from India who came to the US to study genetics. He initially opened the store as a hobby and designed it from the start to attract immigrant patrons, because, as he stated, “anybody who comes from a foreign country, he feels homesick, so why don’t we start an international movie place?” According to the owner, the store has served multiple communities in the Twin Cities area for many years, offering Bollywood films, French films, Hong Kong action films, and so on. Yet the location of the store predates the influx of Somali people in the neighborhood and the owner says he has never had many Somali customers. “They don’t like to watch movies,” he said.

Whether this statement is true or not, it is striking that there is a “diasporic video store” located in the heart of a diasporic community, and if we were only to look at the map, we would likely assume that these things are directly related. But it appears that the global flows of media and people have articulated themselves in a rather disjointed fashion in this local instance. Globalization is complex, to be sure, and so is the local. And, it turns out, “The Midwest” is global, local, and complex too.
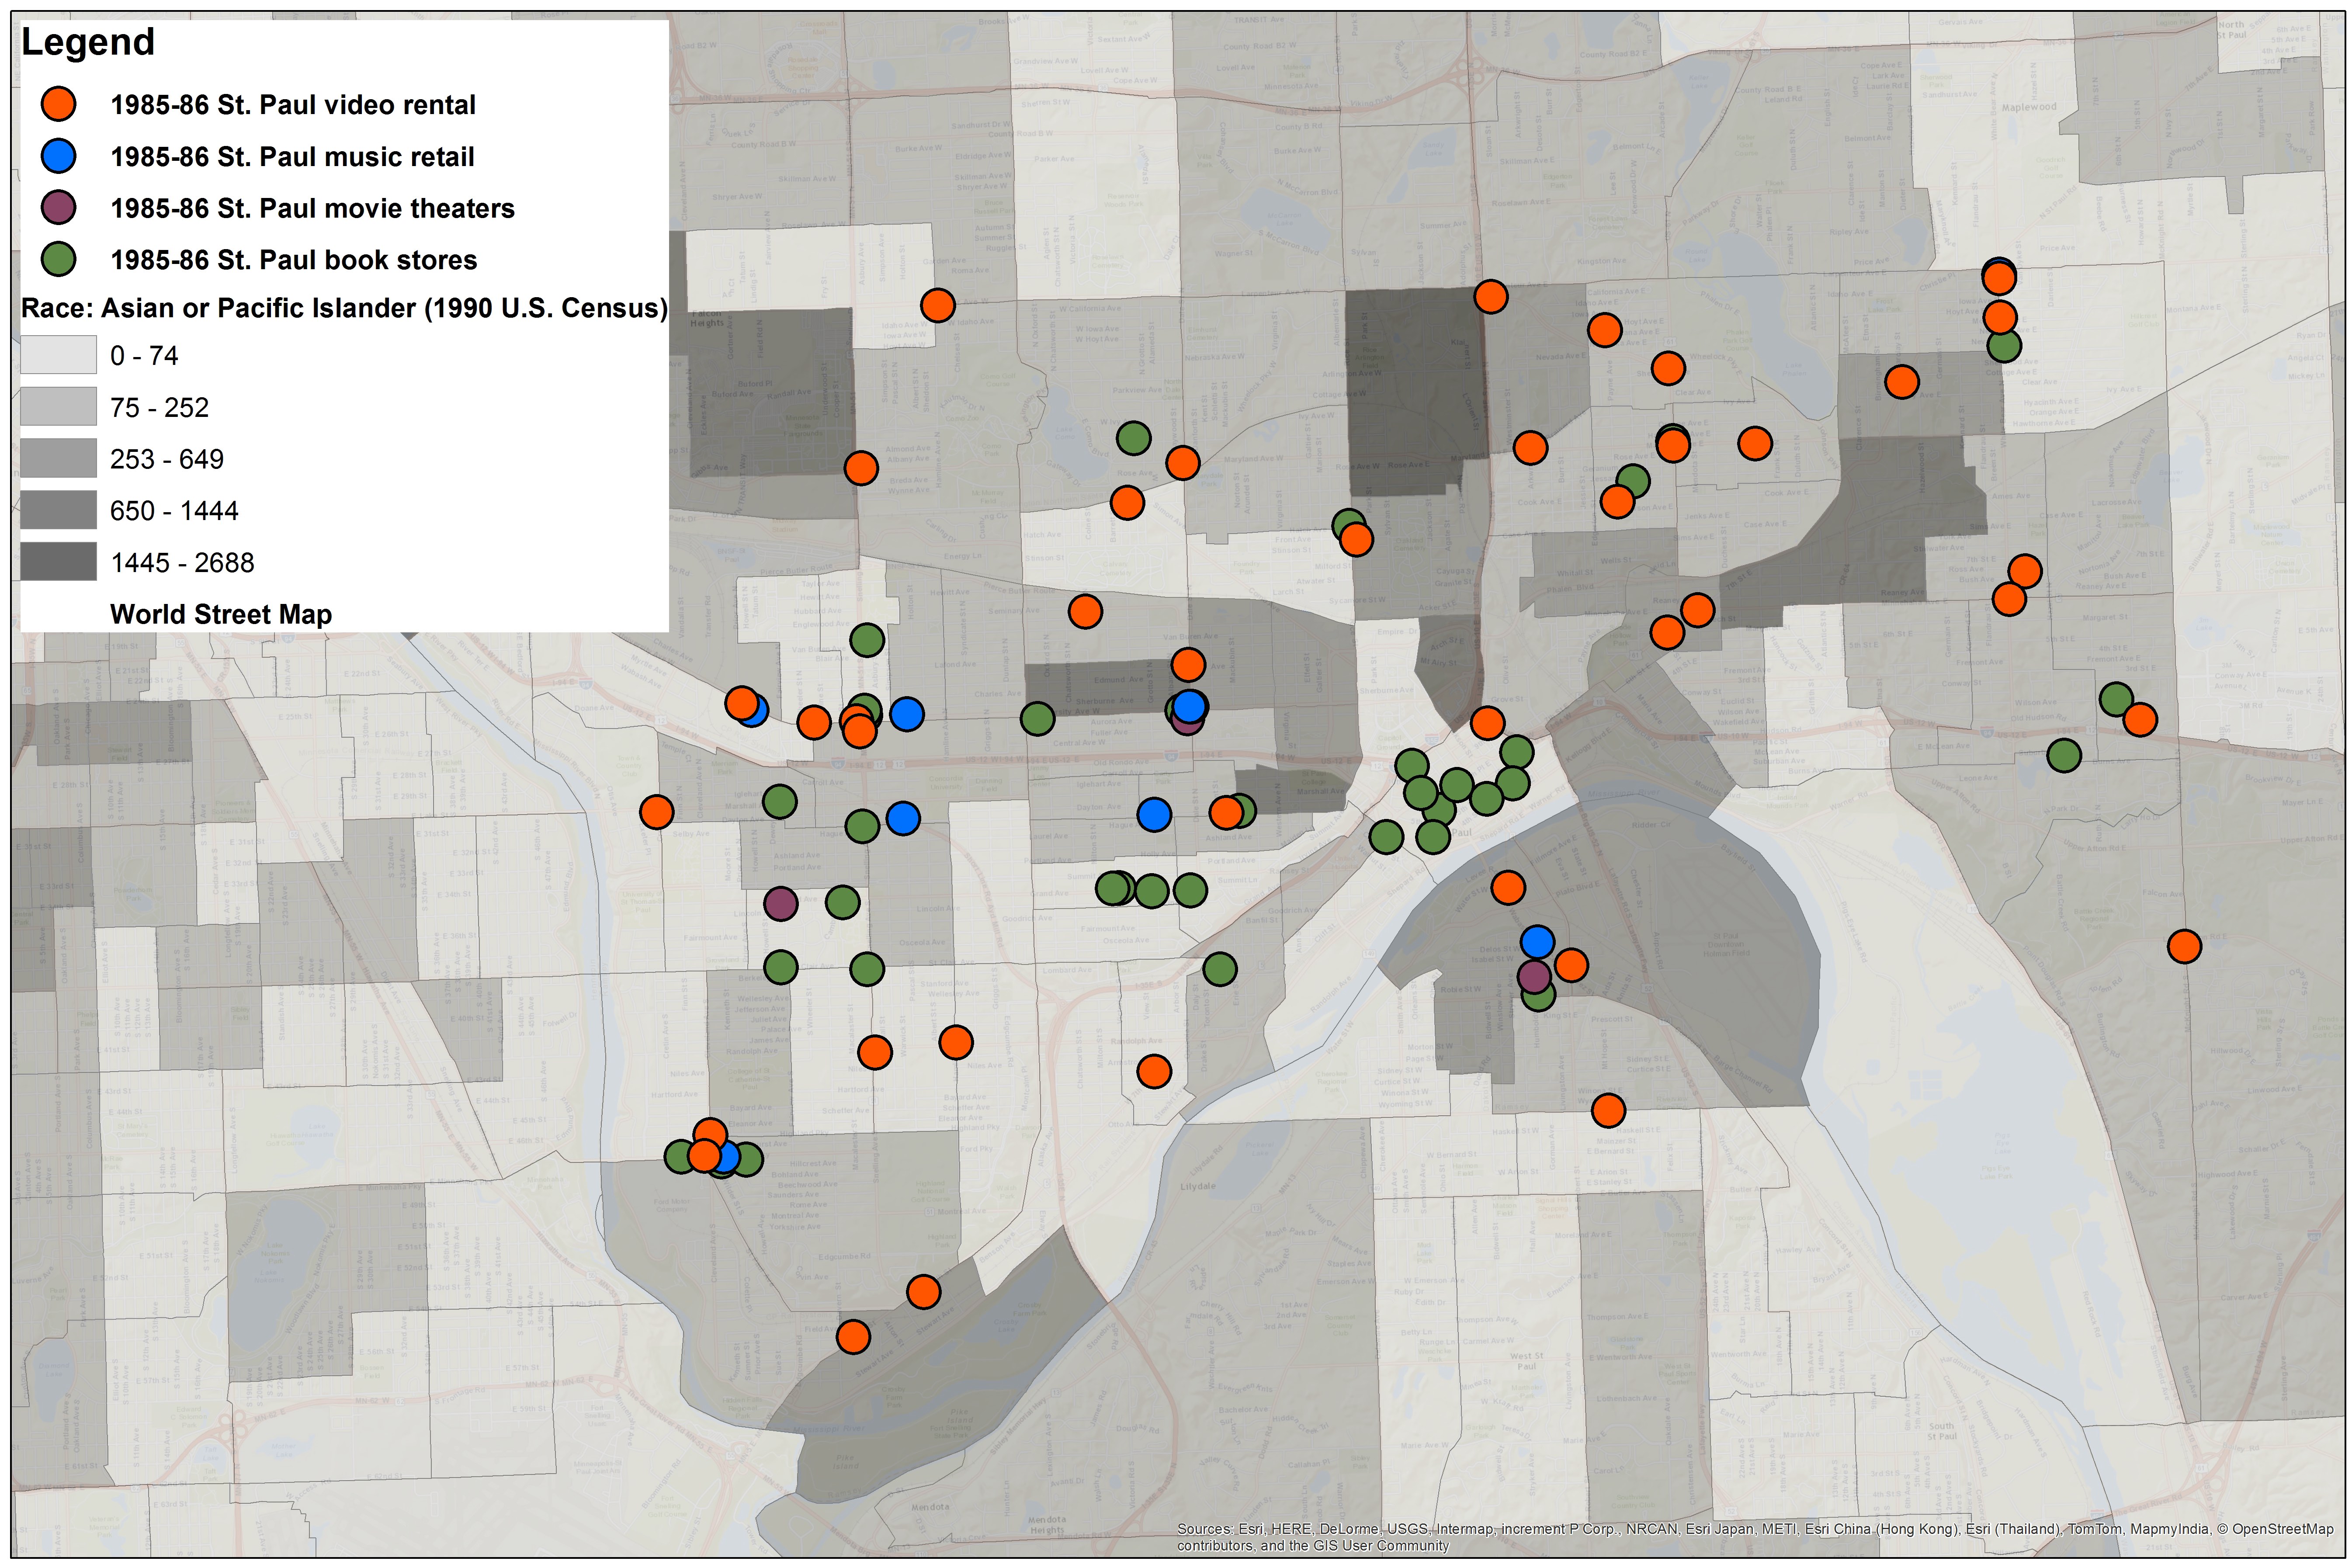
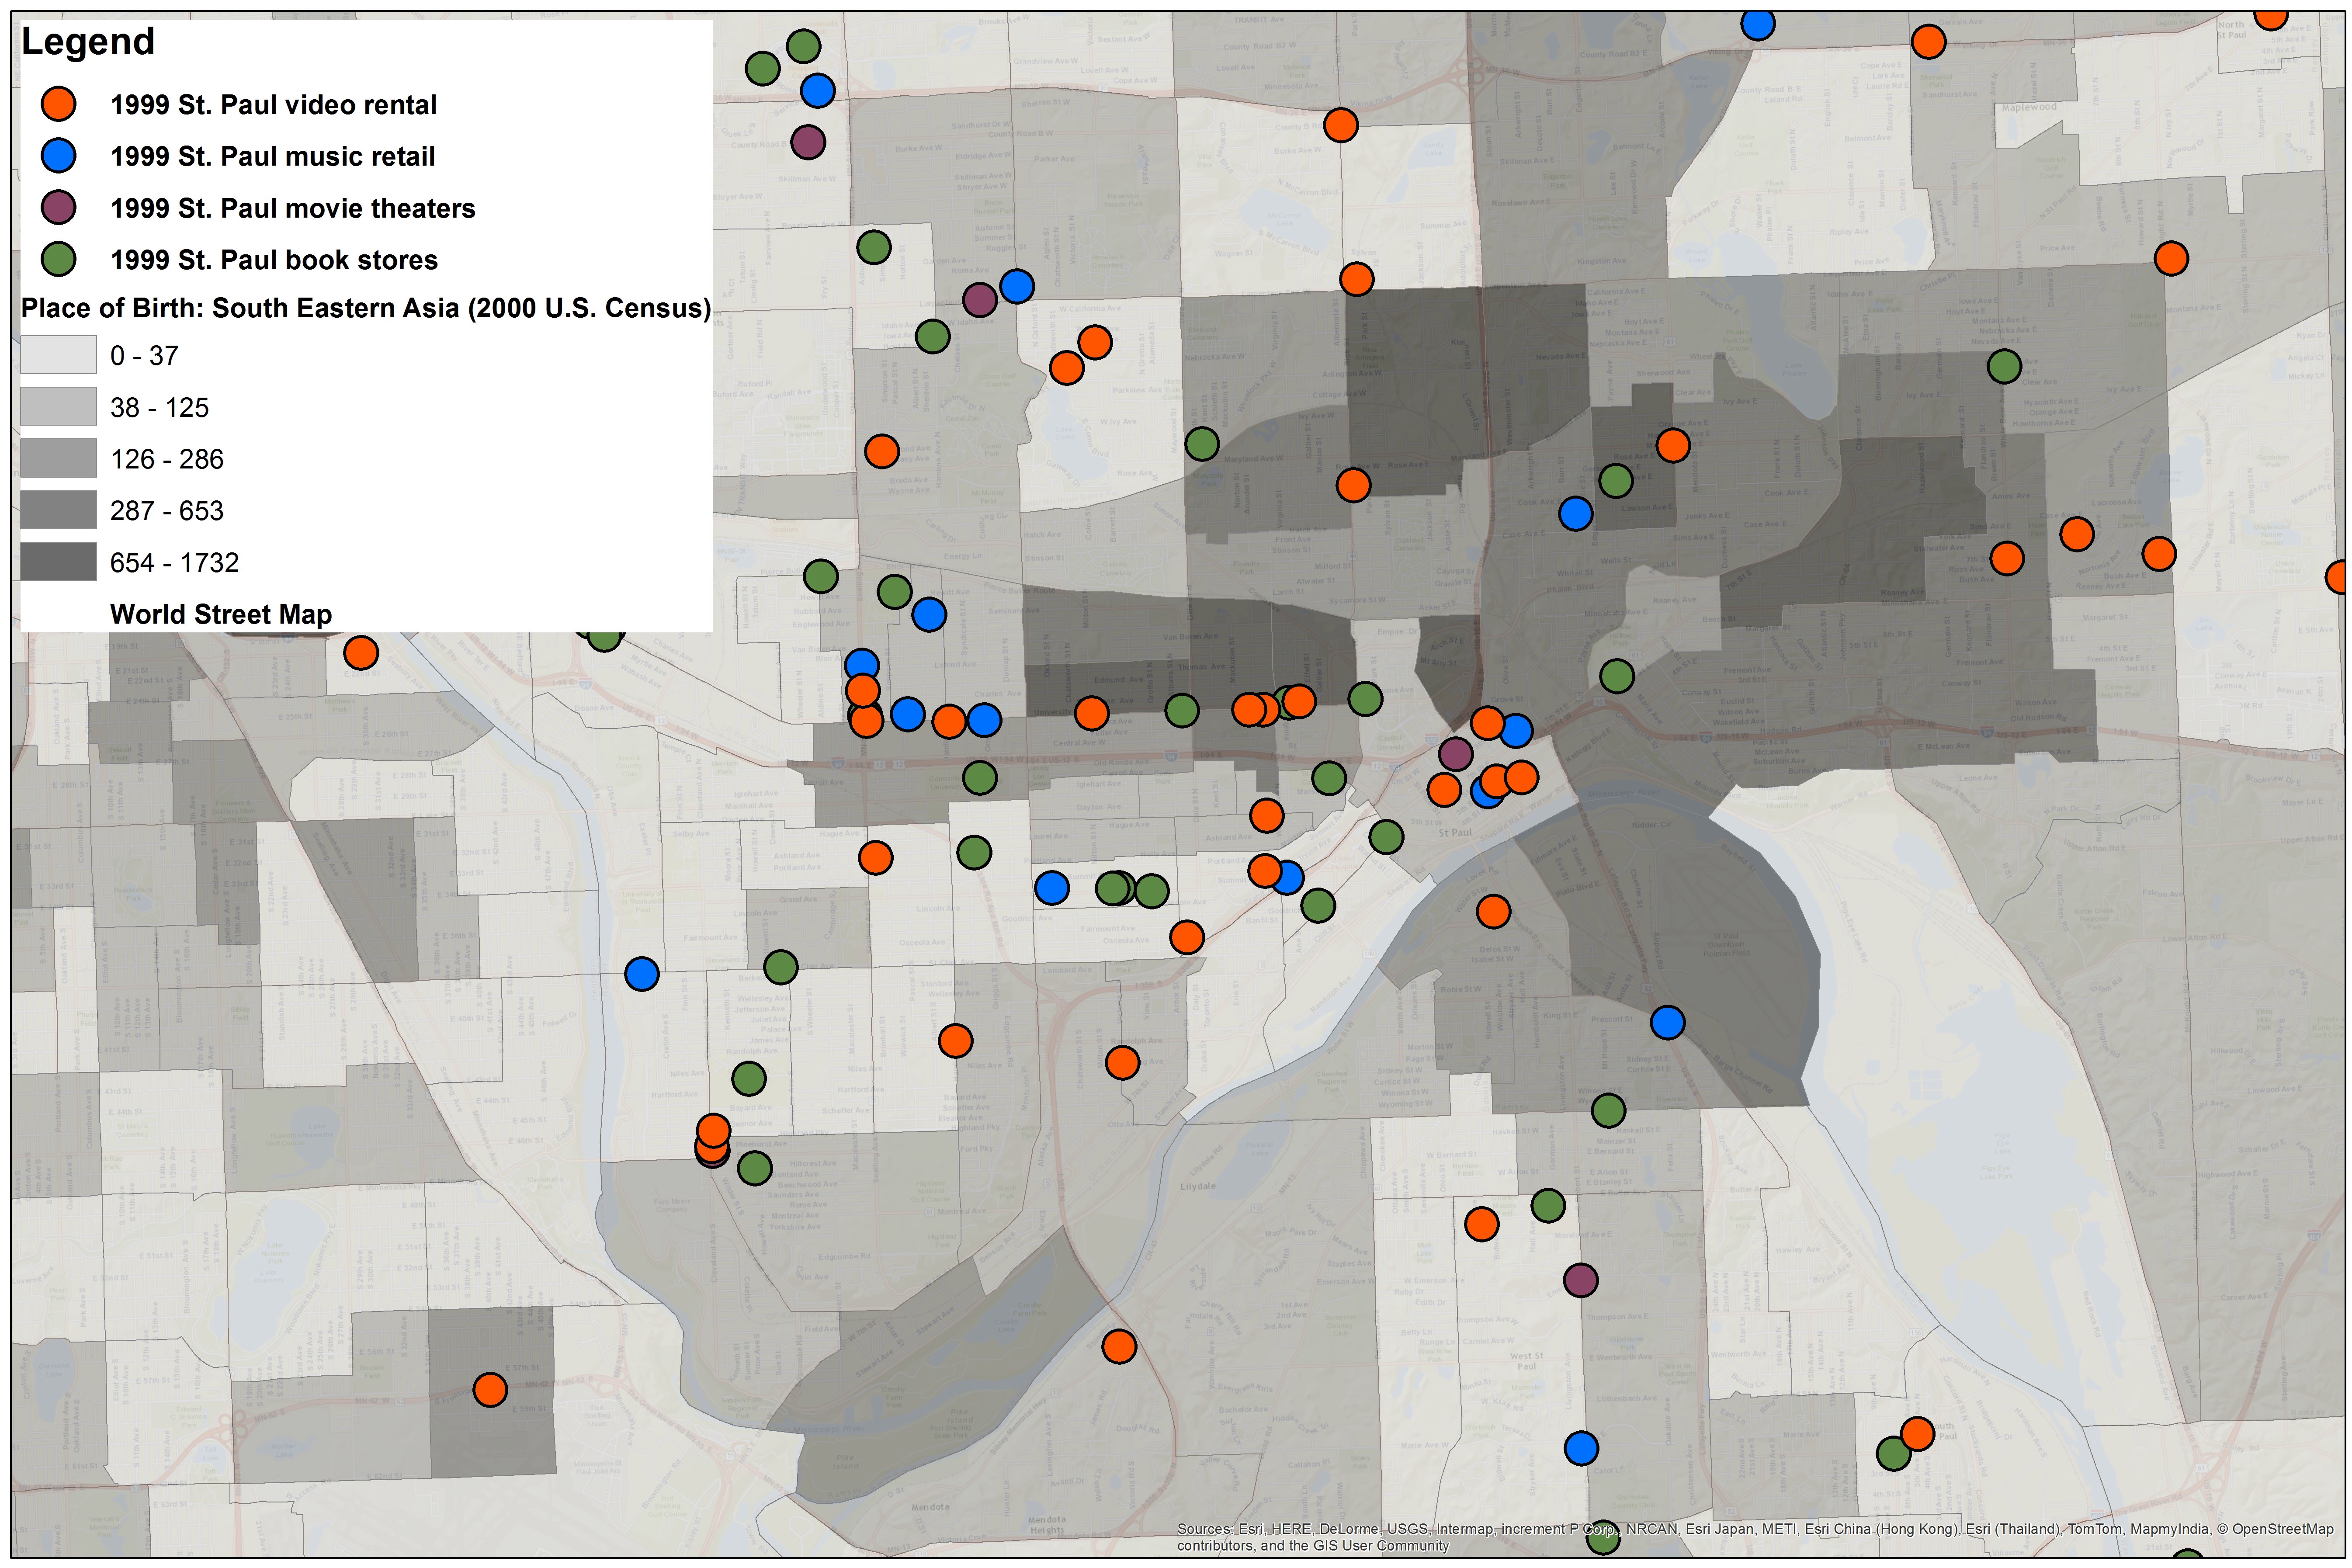
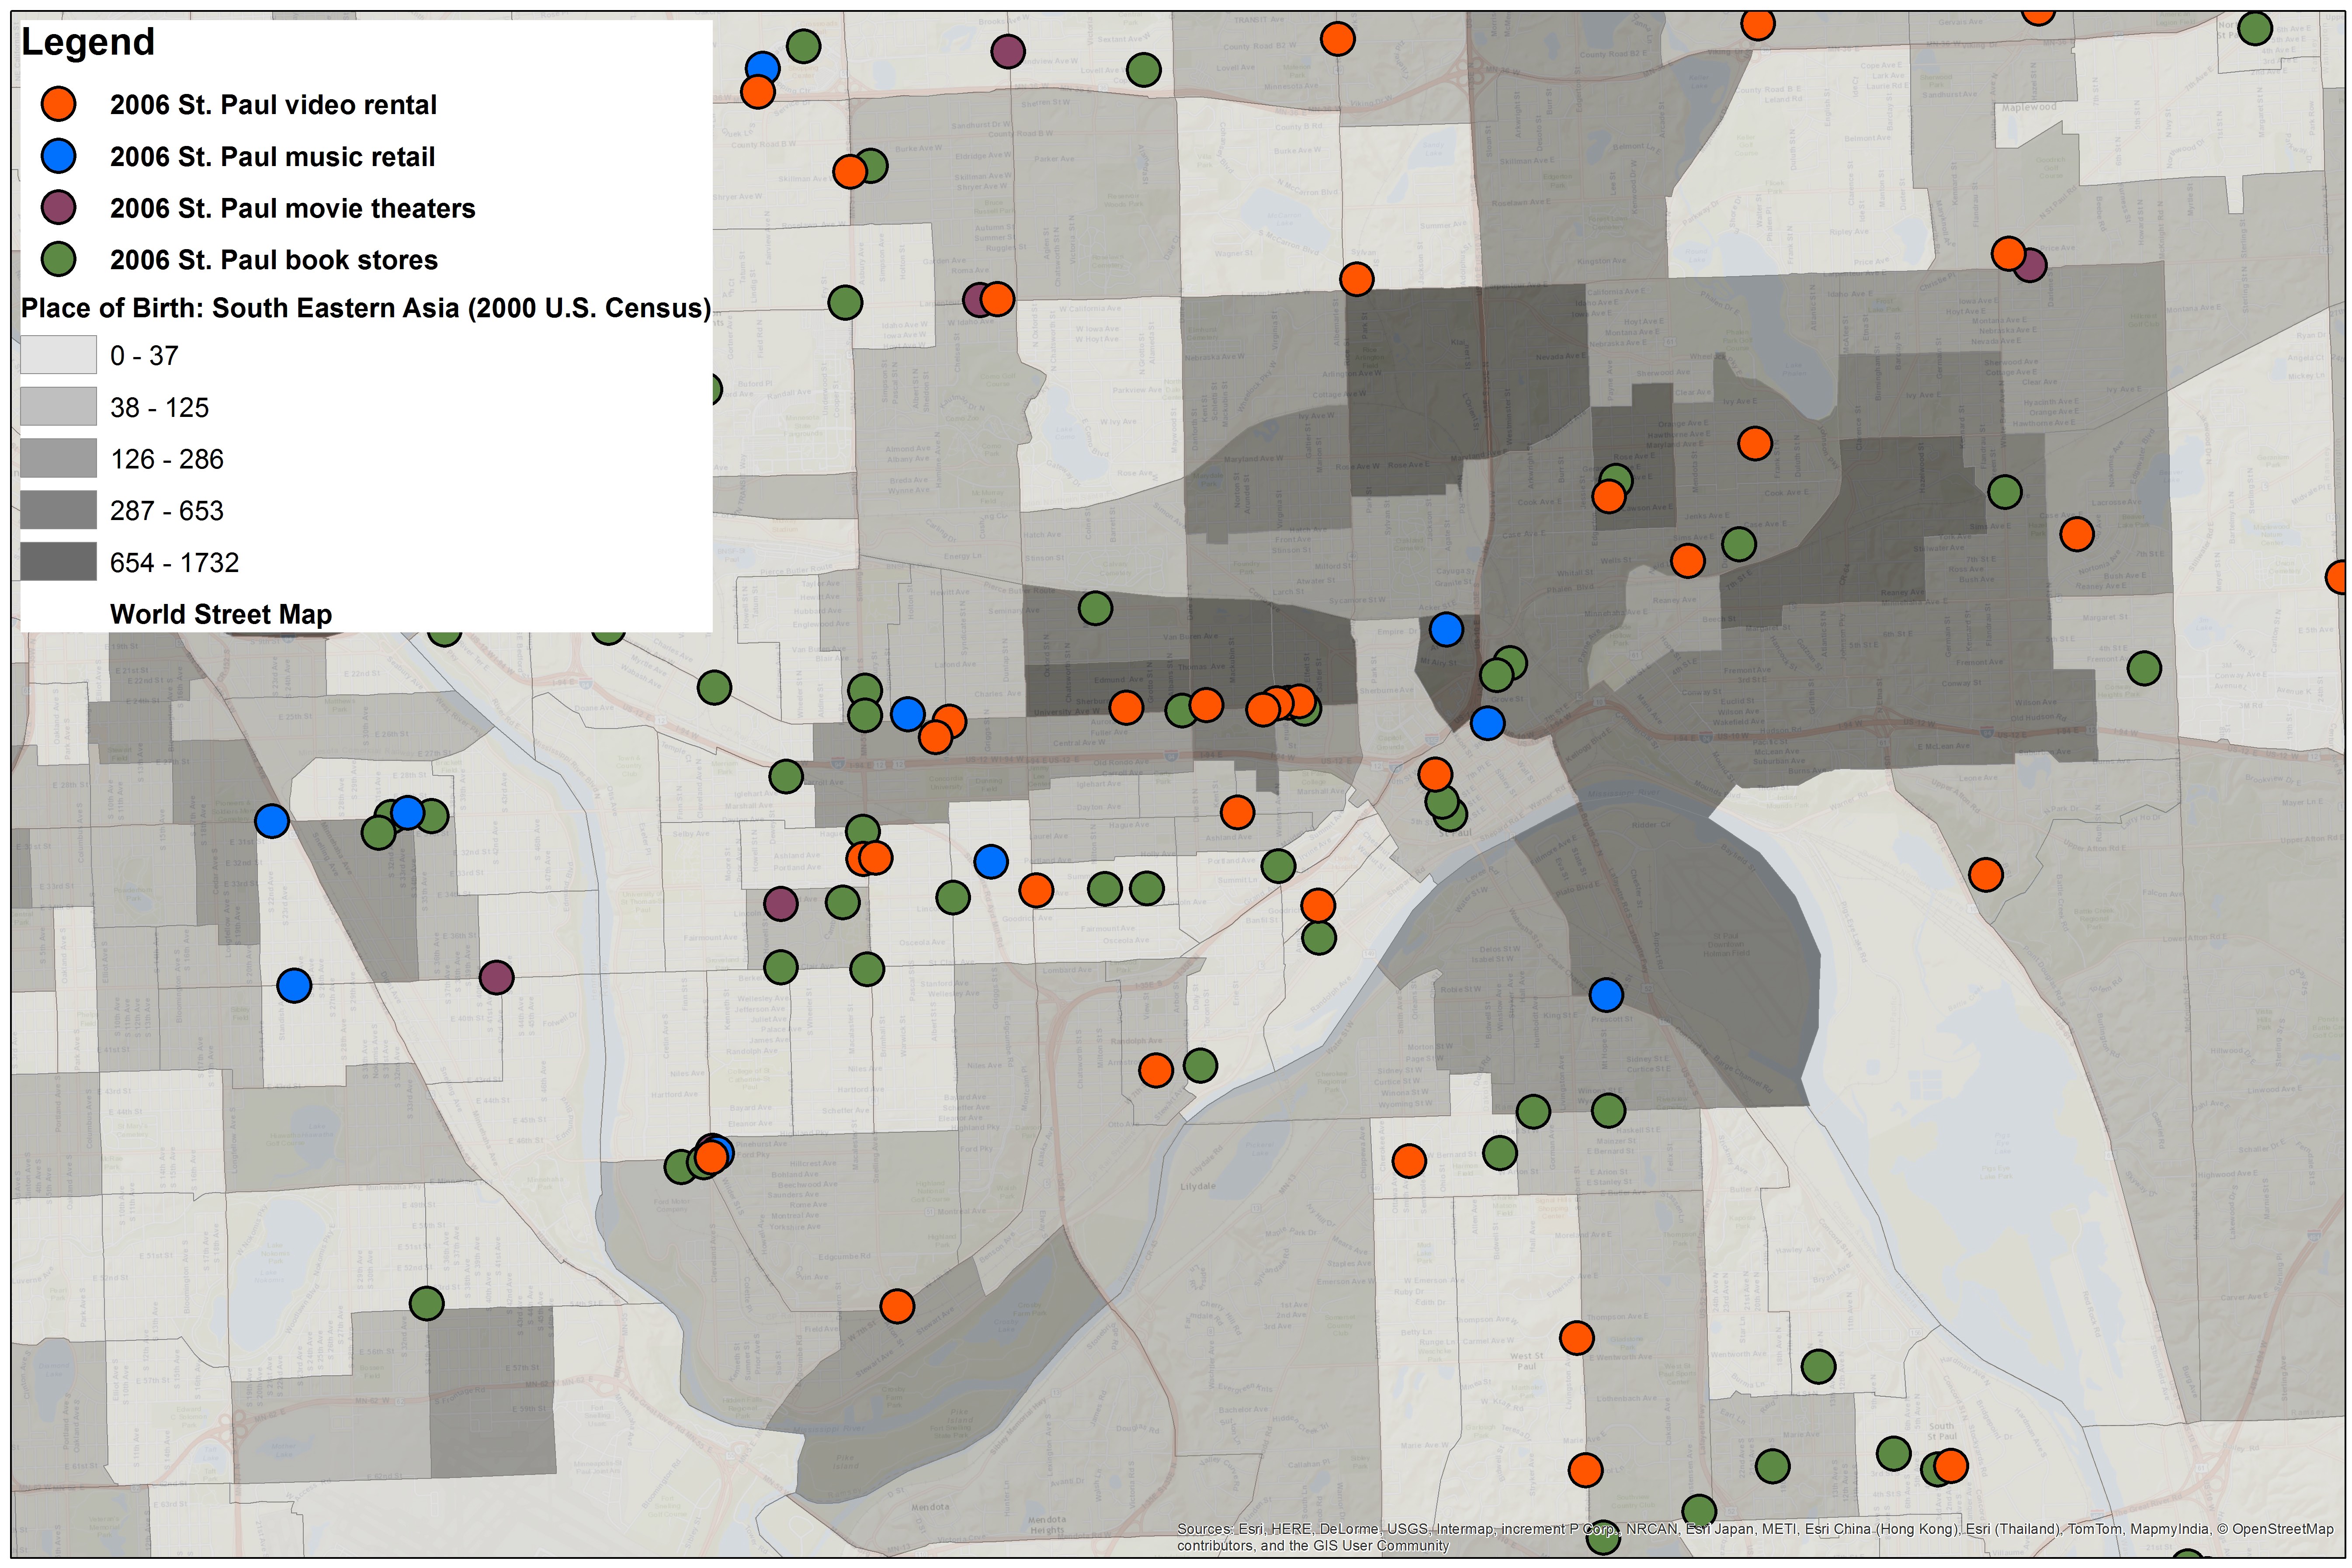
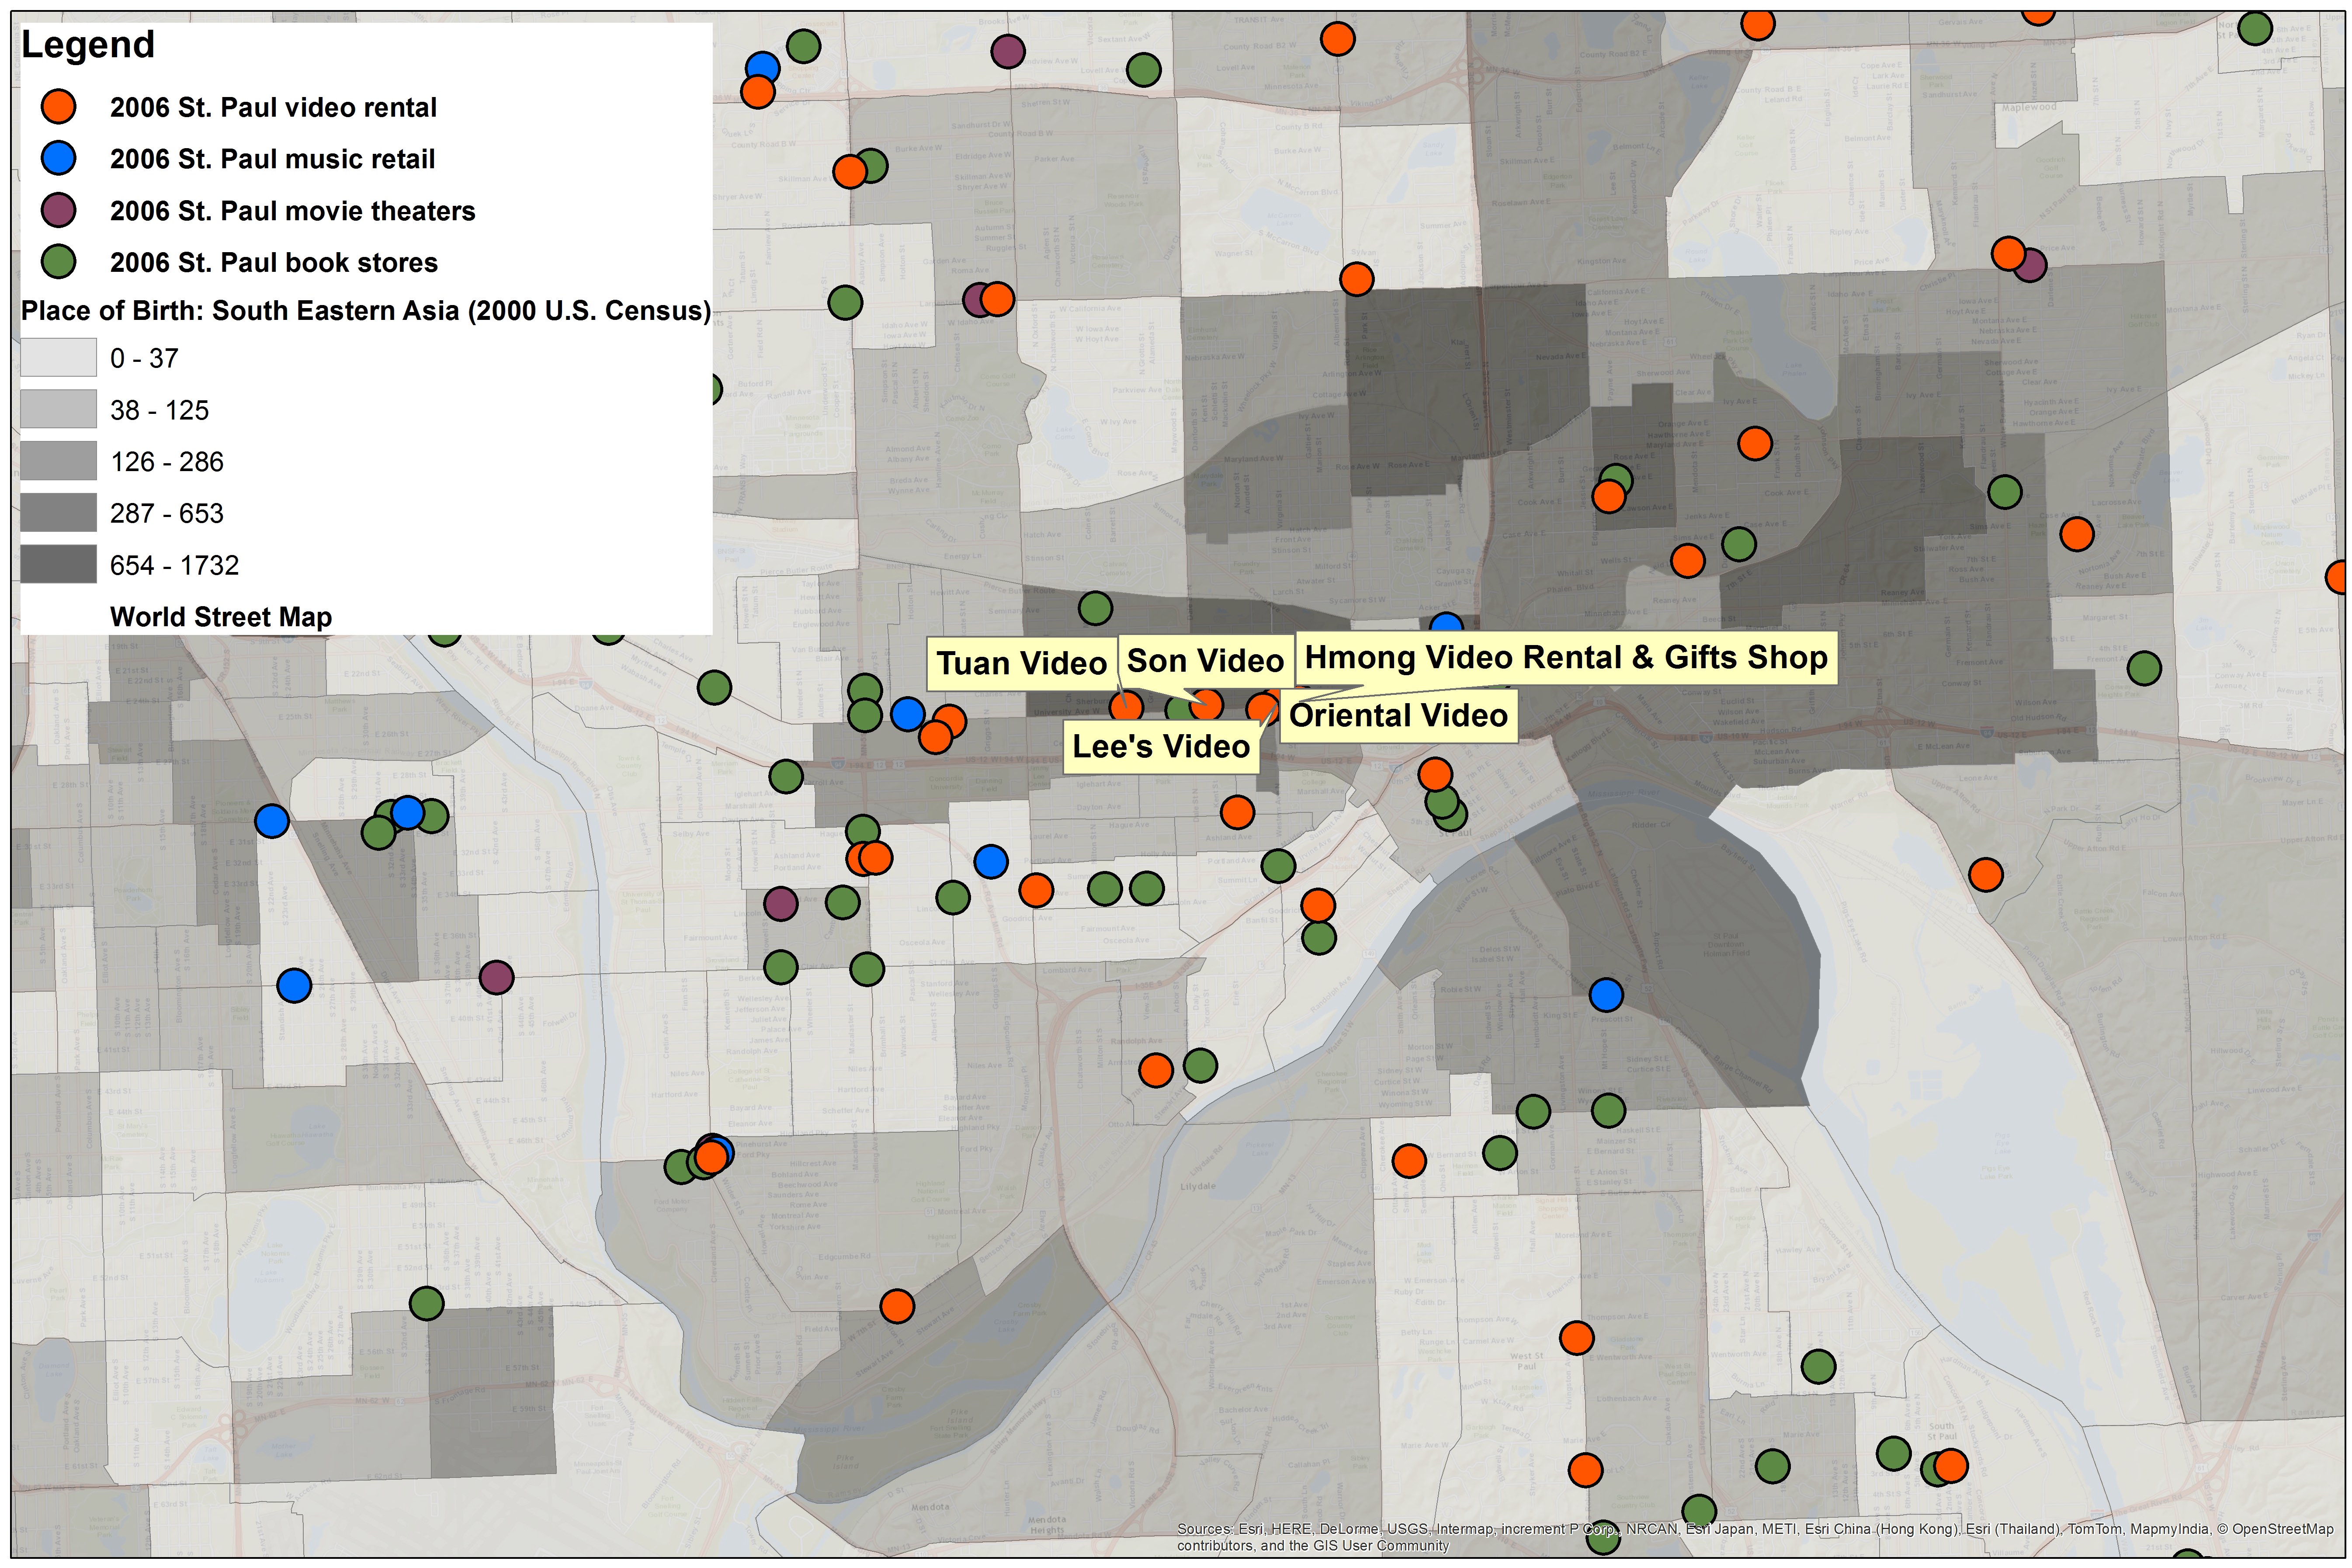
Moving briefly to St. Paul, we can see the location of entertainment retail stores and people from “Asia” or “South Eastern Asia,” as indicated by the US Census, in a short series of maps. In 1985 (figure 15), we see a wide dispersal of video stores and other retail sites; other than a cluster of bookstores in the downtown area, there is no relationship among the stores or between the stores and the Asian population. Similarly, the map from 1999 (figure 16) indicates a large number of entertainment retail stores dispersed rather evenly across the area. But one can see a line of video stores dotted along University Ave. (in the middle of the map), an area with a large number of Hmong people and businesses, suggesting that these stores were part of a larger commercial corridor that served this group. The strip of video stores along University Ave. is even more pronounced in 2006 (figure 17) and the names of many of these stores suggest they were owned by and/or served Hmong and other “South Eastern Asian” people in the area (figure 18). By 2015, however, and like most places in the country, many video stores have disappeared from St. Paul; half of those that remain are in the “South Eastern Asian” parts of the city (figure 19). Interestingly, this map indicates a negative correlation between the South Eastern Asian population and the location of bookstores.
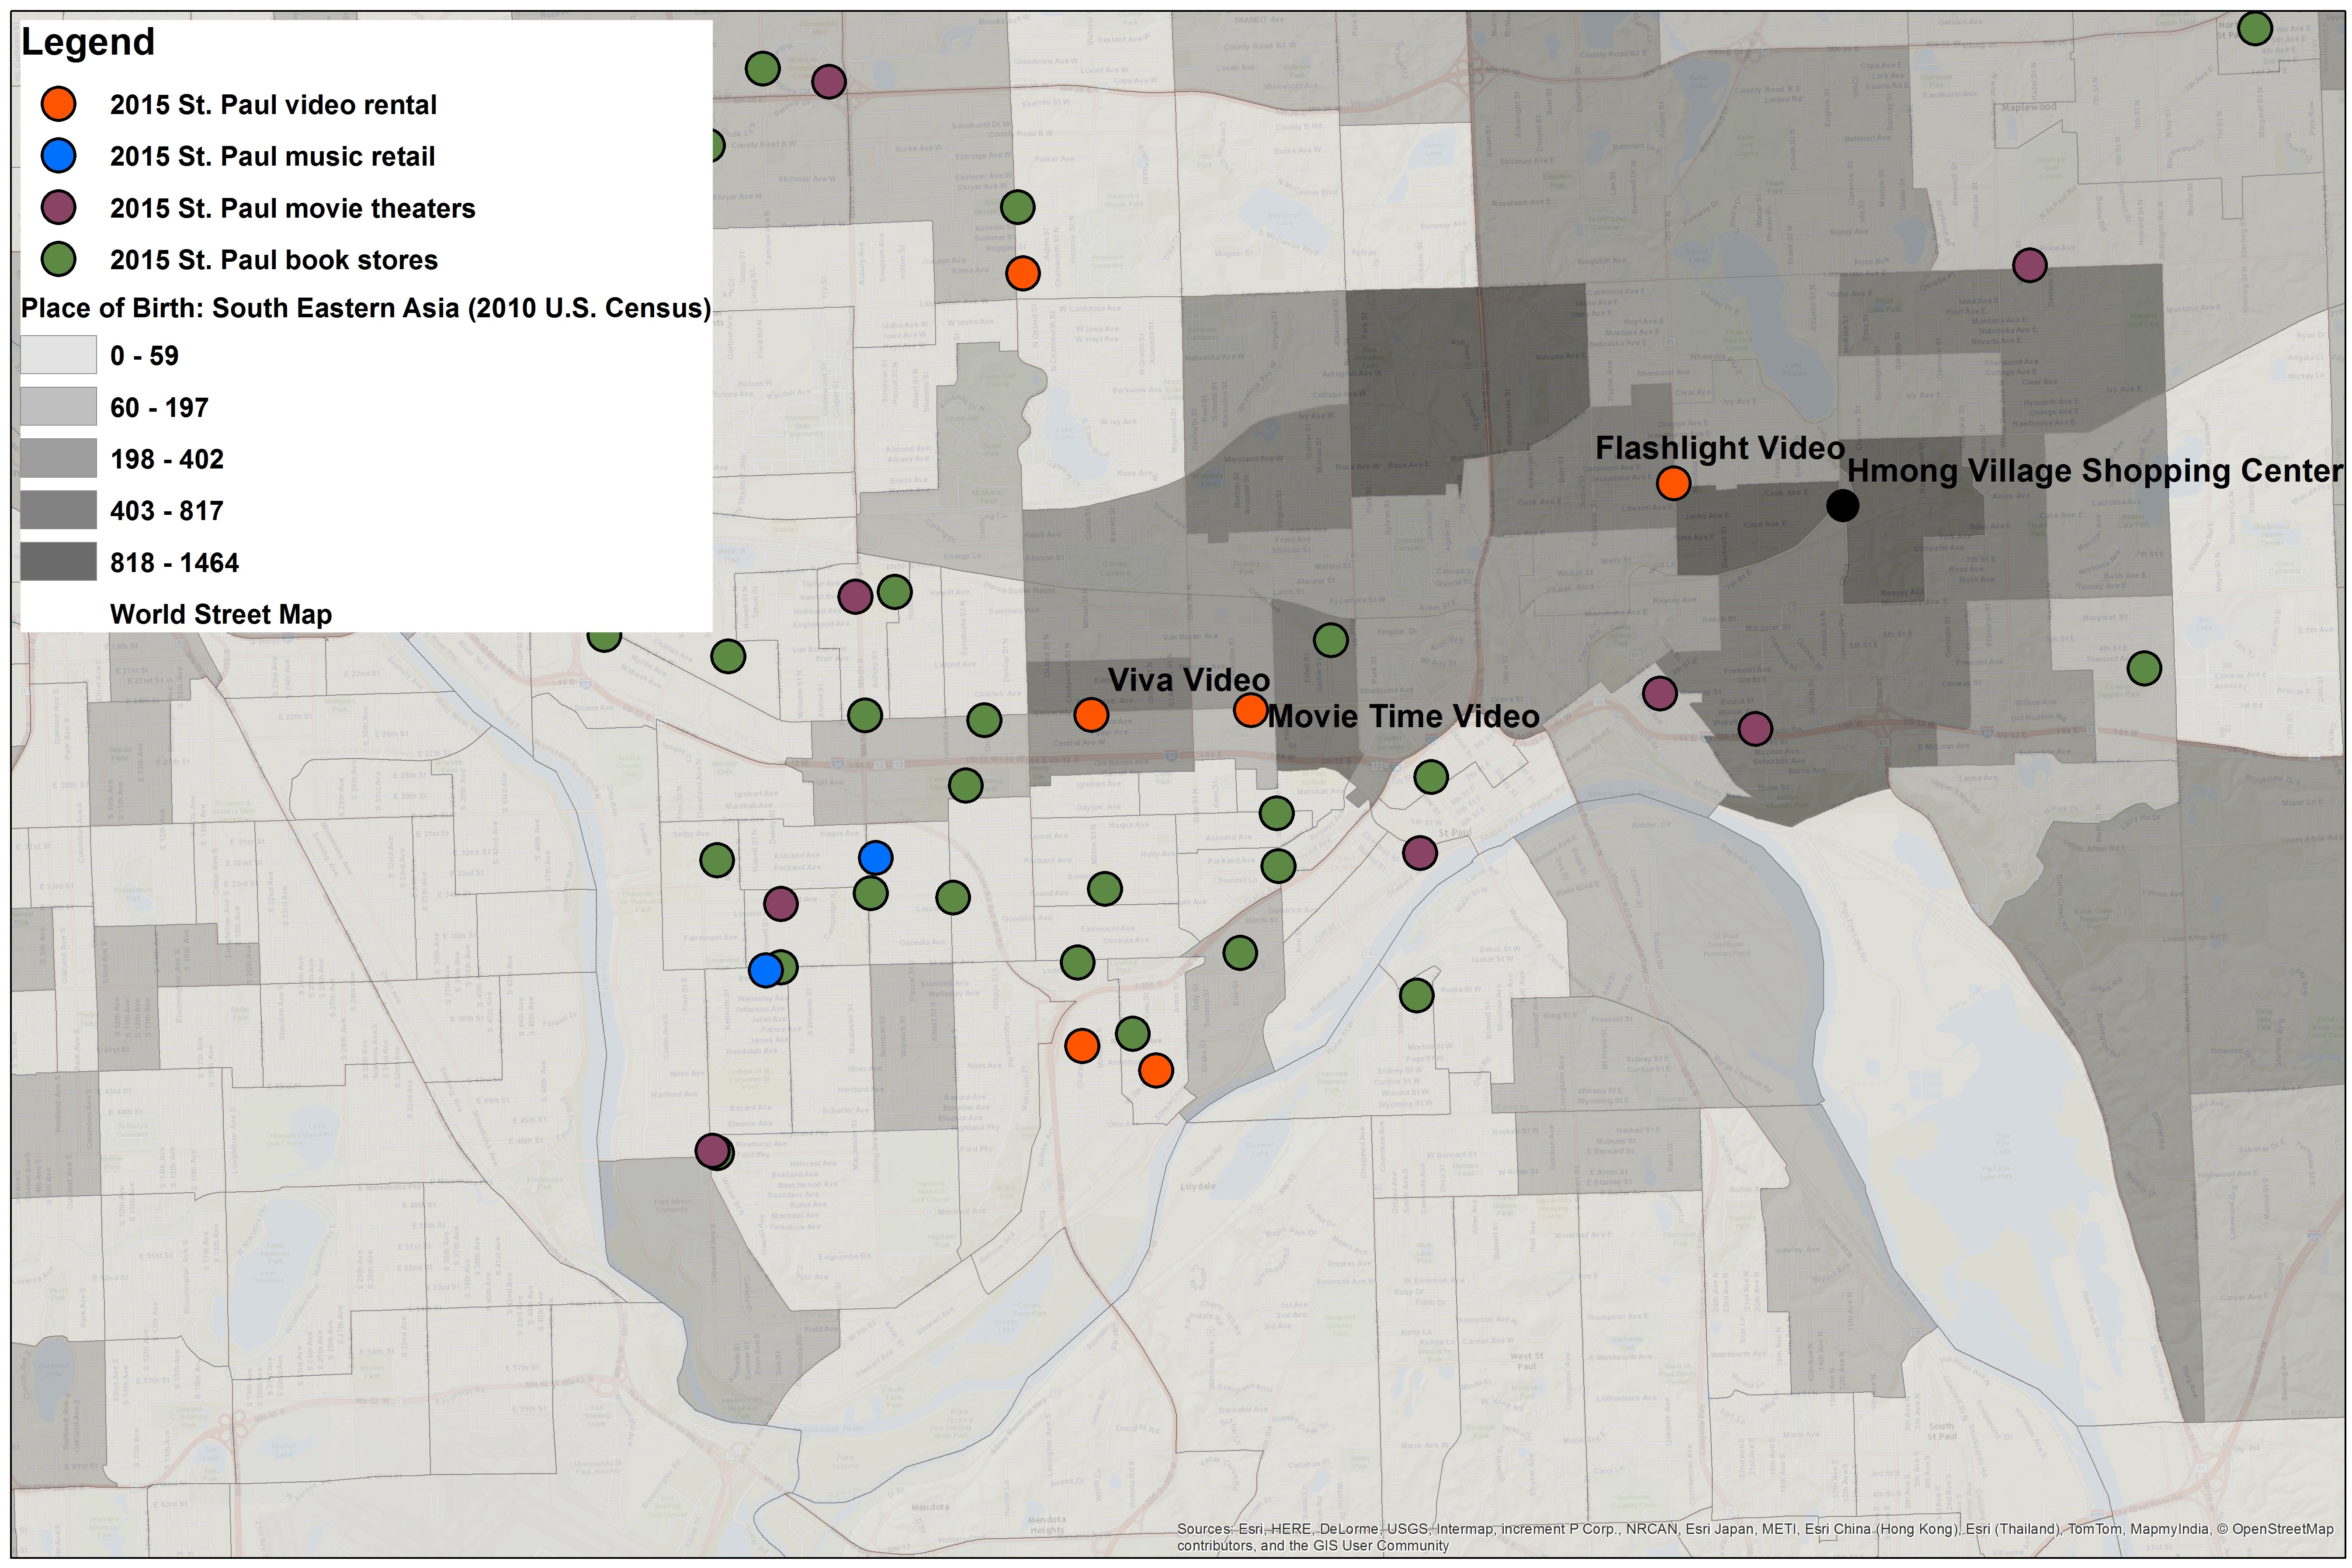
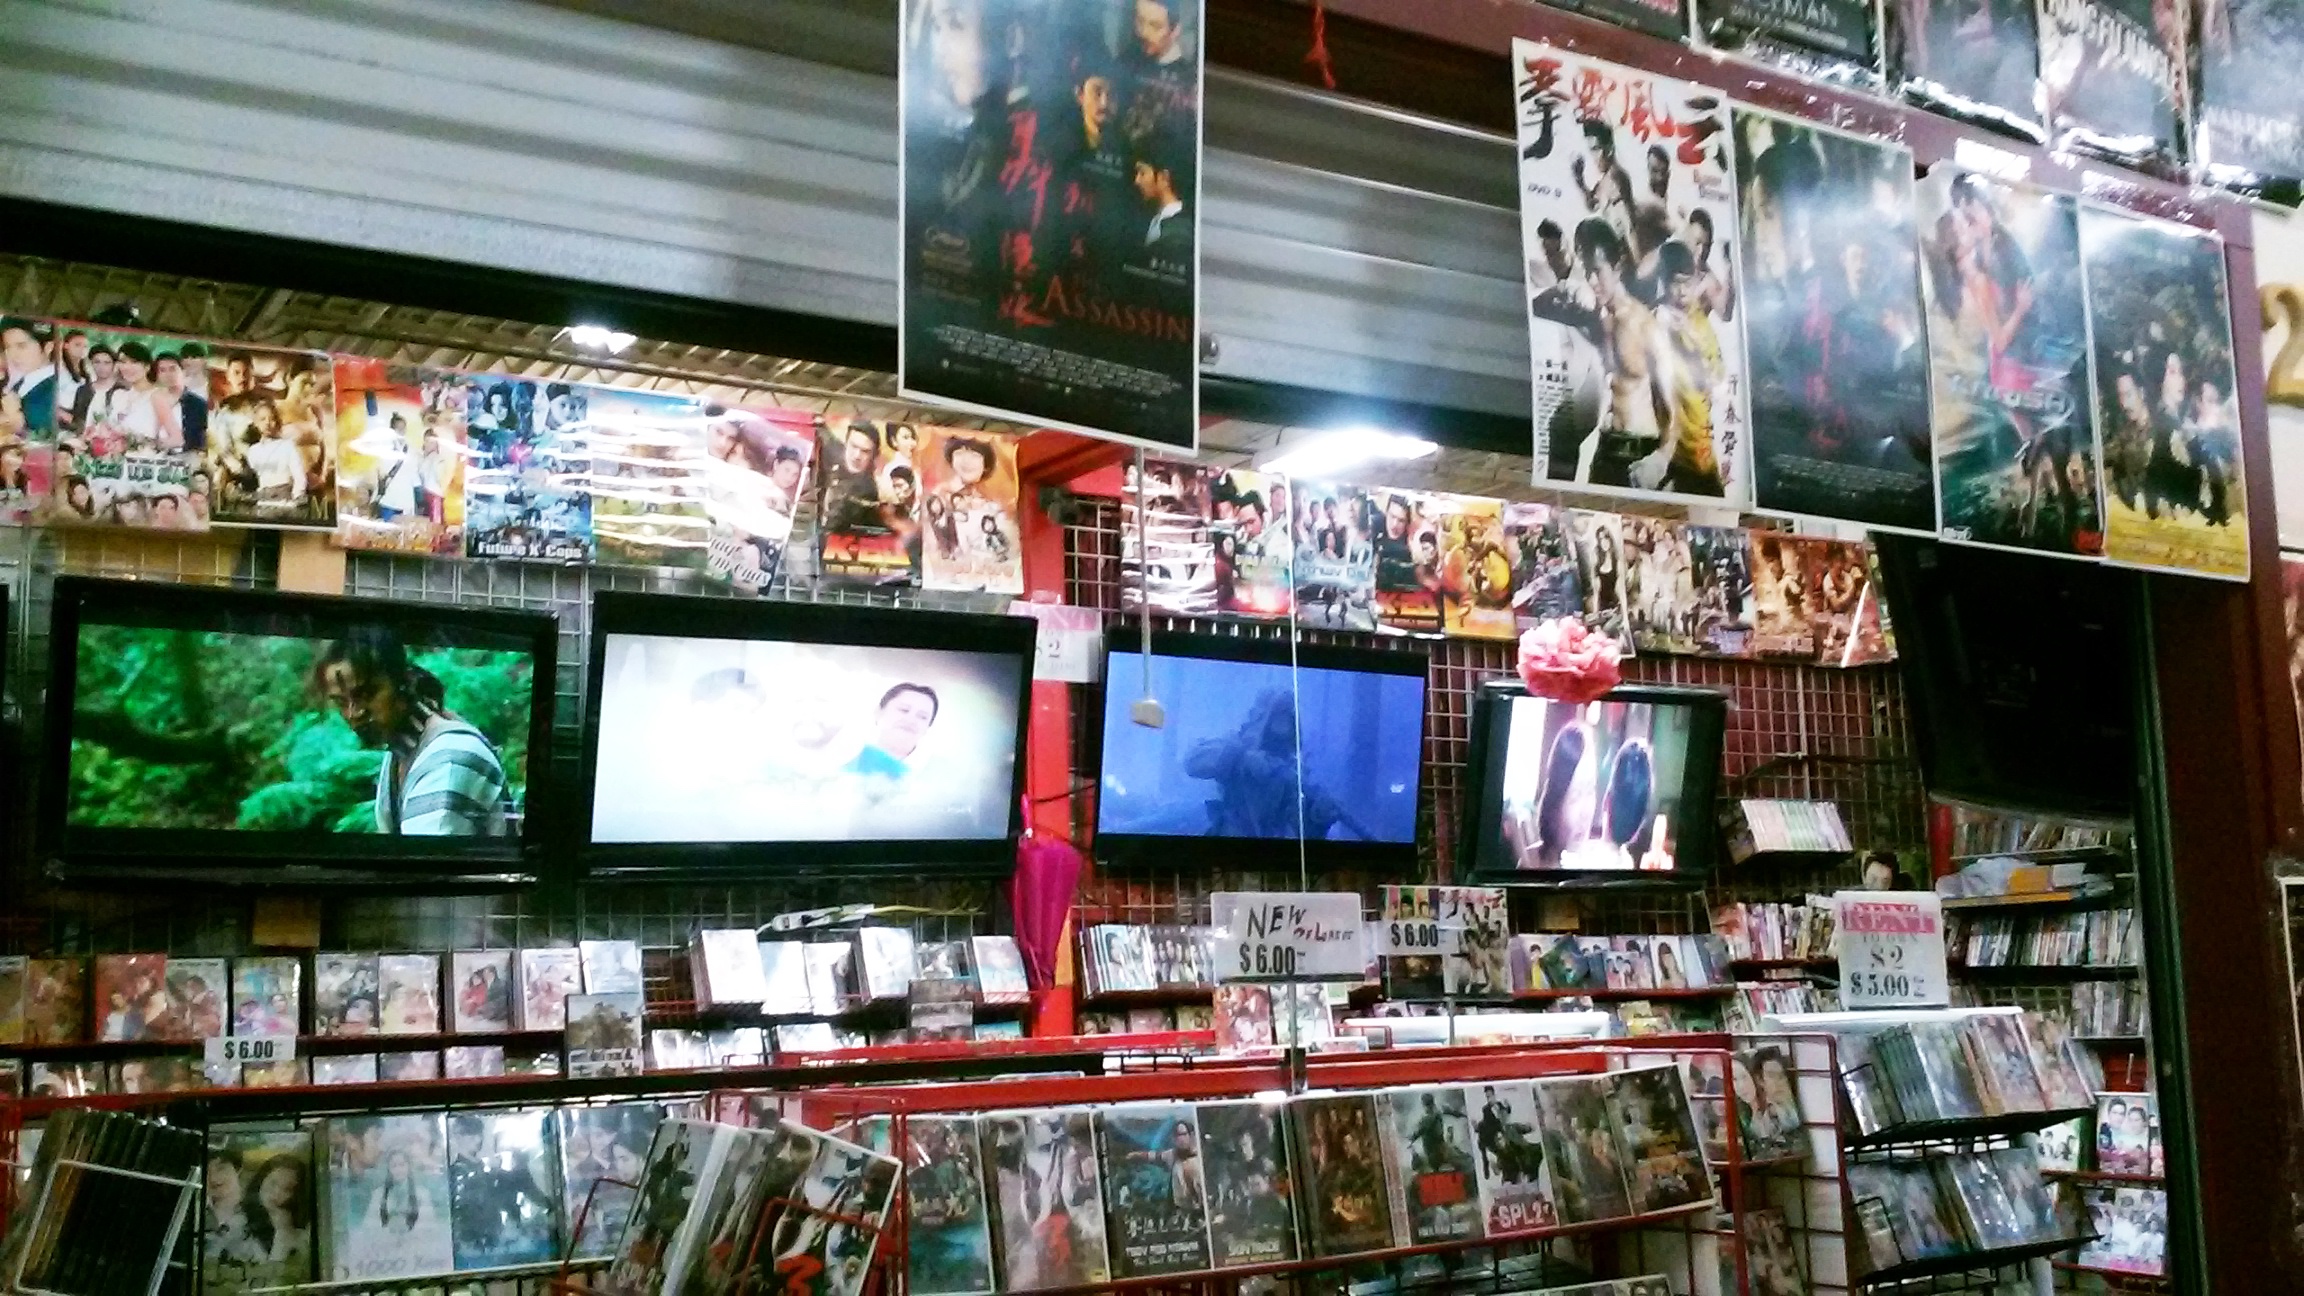
Although figure 19 indicates that two video stores remain open on University Ave., neither was in business when I walked through this area in November 2015. However, I did stumble upon a shop with videos, clothing, and jewelry for sale in a small indoor shopping center on this stretch (figure 20); the female owner identified herself as “Cambodian” and said that she sold movies from Cambodia, China, and Thailand. More significantly, the map from 2015 includes the Hmong Village Shopping Center, a sizable indoor shopping area that features a variety of vendor kiosks, restaurants, and food stalls. Among these, one can find at least six places that sell DVDs from a wide range of Asian countries, many of which, as I understand it, are dubbed for Hmong viewers (figure 21).

On the one hand, we might look at the 2015 map as flawed, as it depicts video stores that are not there, like phantom islands, and does not represent the video retailers that are actually present. On the other hand, we could read this map as pointing the way for an on-the-ground experience of the city, which does in fact reveal some of the ways in which the Hmong diaspora is manifest within the local commercial landscape. The map serves as one point of engagement with a space, which may lead the way to a range of other questions, activities, and modes of experience and knowing.
In my previous contributions to Flow, I have concluded by pointing out some of the problems with the maps I had made and the process of mapping more generally. For this last piece, however, I want to make some positive claims about how the maps, and the entire project, have been useful and instructive to me. First, all the maps confirmed and provided visual “proof” of an argument I made in Videoland, that video rental stores dispersed and diffused movie culture into and throughout local communities; in this respect, the maps serve as an important addendum to my previous work. Second, the maps provided me with a much more detailed and nuanced sense of the complex ways that immigrant and diasporic groups articulate themselves within local retail environments in general and in relation to video stores in particular. To my eye, these maps have represented the “disjuncture and difference in the global cultural economy” of the American Midwest.[ ((Arjun Appadurai, Modernity at Large: Cultural Dimensions of Globalization (Minneapolis: University of Minnesota Press, 1996), 37.))]
Finally, and abstracting from these last two points, the maps have proven useful in representing relationships – in space, over time, and among different people and places. Seeing such relationships can be extremely helpful in telling historical narratives or, even more so, in making space-based historical arguments. Of course no map can truly or fully “speak for itself,” and so the maps remain, to my mind, useful tools that can work in concert with other forms of argumentation and knowledge production. Maps are not only the products of knowledge, but should be taken as starting points for asking any number of new research questions to generate new understandings. Maps can point the way. And then the ethical and ideological questions also emerge. Not, where do you want to go, or, how do I get there? Instead, why do you want to go there and what will you do?
SPECIAL THANKS
This work was supported by MCubed, a funding program at the University of Michigan, awarded during the 2015-2017 cycle. I am grateful to my “cube” partners Phil Hallman and Johannes von Moltke for inspiration and support. I want to thank Dana Rider for invaluable research assistance in Minneapolis and St. Paul, and I also want to thank Debbie Miller and Jennifer Rian who provided excellent guidance at the Minnesota Historical Society Library. Thanks to Lori Lopez, at the University of Wisconsin-Madison, who provided great insights into Hmong movie culture and tipped me off to the Hmong Village Shopping Center. At the University of Michigan, Laura Caruso did an astounding amount of data entry and was a thoughtful sounding board as well. Ben Strassfeld made the maps, and I am grateful for his skill, timeliness, patience, and friendliness.
Image Credits:
1. The Minneapolis metropolitan area (image made by Ben Strassfeld, provided by the author)
2. 1985 Minneapolis entertainment retail locations and population density (image made by Ben Strassfeld, provided by the author)
3. 1985 Minneapolis entertainment retail locations and median household income (image made by Ben Strassfeld, provided by the author)
4. 1985 Minneapolis entertainment retail locations and percentage of white residents (image made by Ben Strassfeld, provided by the author)
5. 1985 Minneapolis entertainment retail locations and number of foreign-born residents (image made by Ben Strassfeld, provided by the author)
6. 1985 Minneapolis entertainment retail locations and percentage of white residents (image made by Ben Strassfeld, provided by the author)
7. 1990 Minneapolis entertainment retail locations and percentage of foreign-born residents (image made by Ben Strassfeld, provided by the author)
8. 1990 Minneapolis entertainment retail locations and percentage of African American residents (image made by Ben Strassfeld, provided by the author)
9. 1990 Minneapolis entertainment retail locations and number of foreign-born residents (image made by Ben Strassfeld, provided by the author)
10. 1999 Minneapolis entertainment retail locations and percentage of white residents (image made by Ben Strassfeld, provided by the author)
11. 1999 Minneapolis entertainment retail locations and percentage of African American residents (image made by Ben Strassfeld, provided by the author)
12. 1999 Minneapolis entertainment retail locations and number of Eastern African-born residents (image made by Ben Strassfeld, provided by the author)
13. 2015 Minneapolis entertainment retail locations and number of Eastern African-born residents (image made by Ben Strassfeld, provided by the author)
14. The exterior of Intercontinental Video Sales and Rental, Minneapolis, MN (image taken and provided by the author)
15. 1985-86 St. Paul entertainment retail locations and number of Asian or Pacific Islander residents (image made by Ben Strassfeld, provided by the author)
16. 1999 St. Paul entertainment retail locations and number of Southeast Asian residents. (image made by Ben Strassfeld, provided by the author)
17. 2006 St. Paul entertainment retail locations and number of South Eastern Asian residents (image made by Ben Strassfeld, provided by the author)
18. 2006 St. Paul entertainment retail locations and number of South Eastern Asian residents (image made by Ben Strassfeld, provided by the author)
19. 2015 St. Paul entertainment retail locations and number of South Eastern Asian residents (image made by Ben Strassfeld, provided by the author)
20. Interior of a University Ave. Cambodian-owned store (image taken and provided by the author)
21. Interior of a store in the Hmong Village Shopping Center, St. Paul, MN (image taken by Dana Rider and provided by the author)
Please feel free to comment.
The answer of this question is only available at this Online tutorial. So you need to follow this homepage and learn what is csrss.exe and how to remove this error permanently from your windows 10 OS desktop. Thank you so much to this very knowledgeable post.